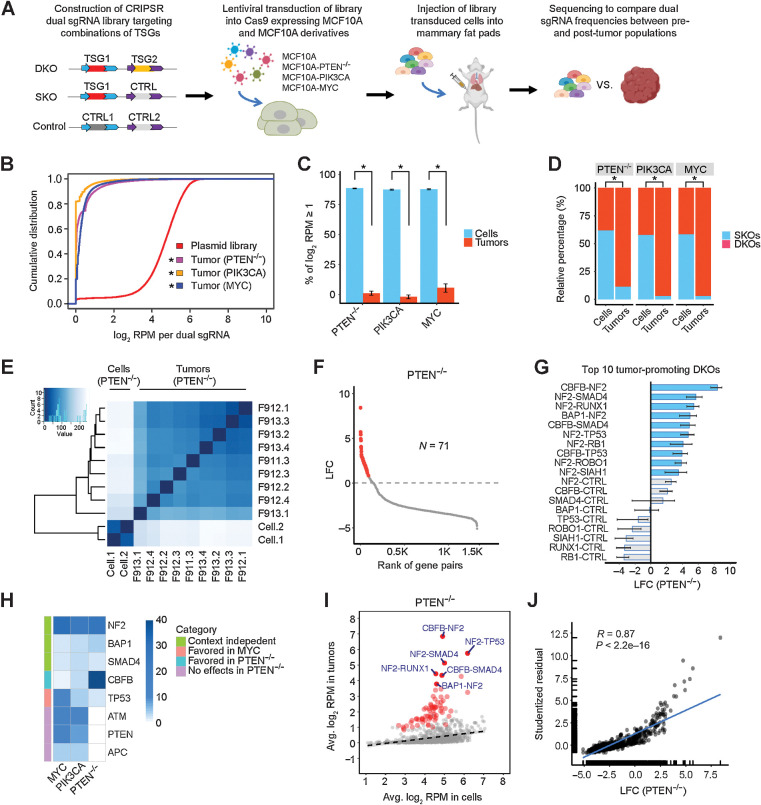
Figure 1.
Perturbations in TSG pairs promote tumorigenesis in vivo. A, Schematic of combinatorial CRISPR screening in vivo. B, Cumulative distributions of dual sgRNA abundance in the plasmid library and tumors. *, P < 0.05; Kolmogorov–Smirnov test. C, Percentage of dual sgRNAs with log2 RPM ≥1 in the PTEN−/−, PIK3CA, and MYC cell libraries and tumors. Data are presented as mean ± SEM. Mean values were calculated from nine PTEN−/−, three PIK3CA, and six MYC tumors. *, P < 0.01; one-sided Student t test. D, Relative percentage of DKO/SKO normalized counts in the PTEN−/−, PIK3CA, and MYC cell libraries and tumors. *, P < 0.01; one-sided Student t test. E, Heatmap of Euclidean distances between all the cell and tumor samples (PTEN−/−). F, The effect size (LFC) of DKOs and SKOs in the PTEN−/− context. A total of 71 oncogenic perturbations are highlighted in red. G, The top 10 tumor-promoting DKOs and corresponding SKOs in the PTEN−/− context. The mean is plotted along with the 95% CI. H, Heatmap comparing the single-gene tumorigenic effects in the PTEN−/−, PIK3CA, and MYC contexts. I, Scatter plot of average log2 RPM in the PTEN−/− tumors versus preinjected cell libraries. A total of 71 oncogenic perturbations shown in F are highlighted in red, and the top 6 ones are labeled. The linear regression line is shown (dashed). J, Scatter plot and correlation analysis of the tumorigenic effects measured by quantile analysis versus average based regression (PTEN−/−).

