. 2021 Sep 24;81(24):6090–6105. doi: 10.1158/0008-5472.CAN-21-2555

Figure 3.

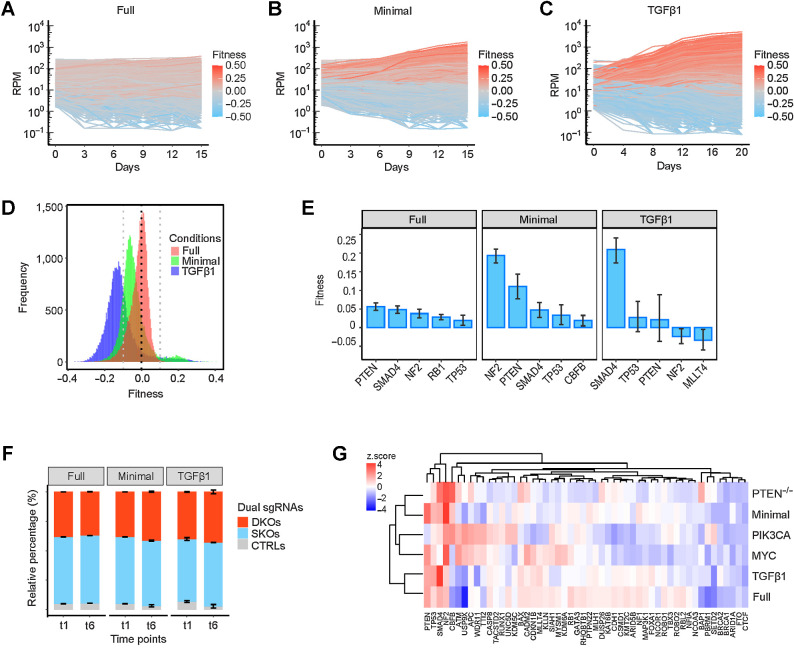
Figure 3. Growth-promoting effects of TSG perturbations in vitro. A–C, Representative trajectories of cell lineages expressing unique dual sgRNAs grown in full, minimal, and TGFβ1-supplemented media, respectively. D, Distribution of gene-level fitness of 1,378 perturbations in the three conditions. E, The top five single-gene effects on fitness in the three conditions. Data are presented as mean ± SEM. F, Relative percentage of DKO/SKO normalized counts in the three conditions. Data are presented as mean ± SEM. G, A heatmap that shows the comparison of growth-promoting effects in vitro and tumorigenic effects in vivo of SKOs.

Growth-promoting effects of TSG perturbations in vitro. A–C, Representative trajectories of cell lineages expressing unique dual sgRNAs grown in full, minimal, and TGFβ1-supplemented media, respectively. D, Distribution of gene-level fitness of 1,378 perturbations in the three conditions. E, The top five single-gene effects on fitness in the three conditions. Data are presented as mean ± SEM. F, Relative percentage of DKO/SKO normalized counts in the three conditions. Data are presented as mean ± SEM. G, A heatmap that shows the comparison of growth-promoting effects in vitro and tumorigenic effects in vivo of SKOs.