Figure 4.
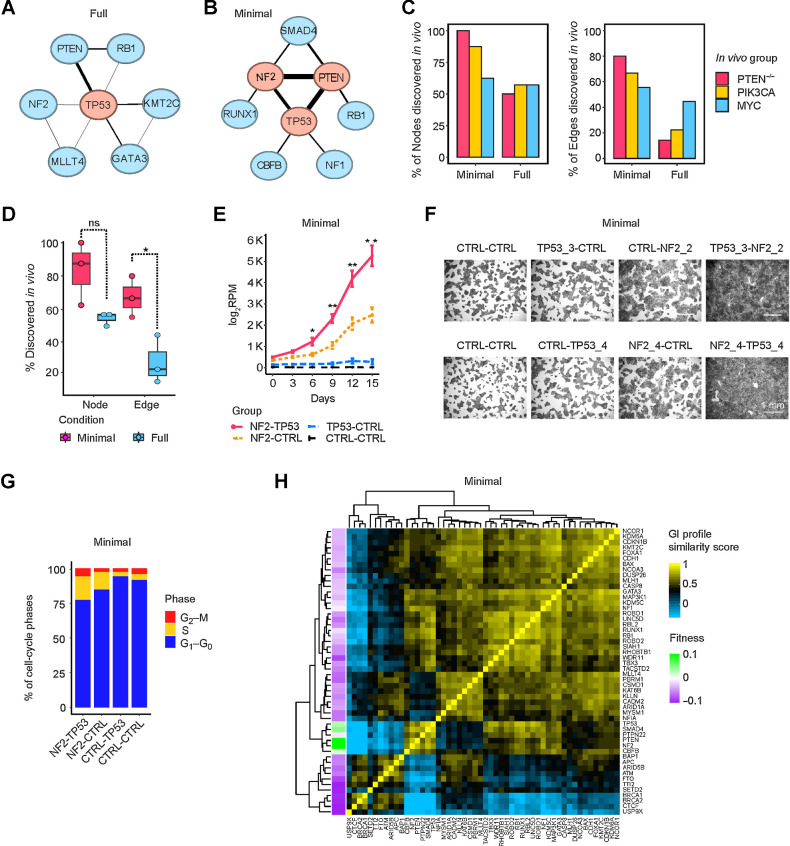
Growth-promoting networks in minimal medium resemble in vivo tumor-promoting networks. A and B, Growth-promoting GI network in full and minimal media. The top three central nodes are highlighted in red. C, Comparison of growth/tumor-promoting GI networks in vitro and in vivo, with respect to nodes (left) and edges (right). D, Percentage of nodes and edges in vitro that were discovered in GI networks in vivo. Data are presented as mean ± SEM. *, P < 0.05; one-sided Student t test. ns, not significant. E–G, Growth curves, crystal-violet staining, and cell-cycle cytometric analysis of NF2-TP53 DKO, NF2-CTRL, or TP53-CTRL SKO and control cells in minimal medium. Data are presented as mean ± SEM in E. *, P < 0.1; **, P < 0.05; one-sided Student t test. H, GI profiles of 52 TSGs in minimal medium.

