. 2021 Sep 24;81(24):6090–6105. doi: 10.1158/0008-5472.CAN-21-2555

Figure 5.

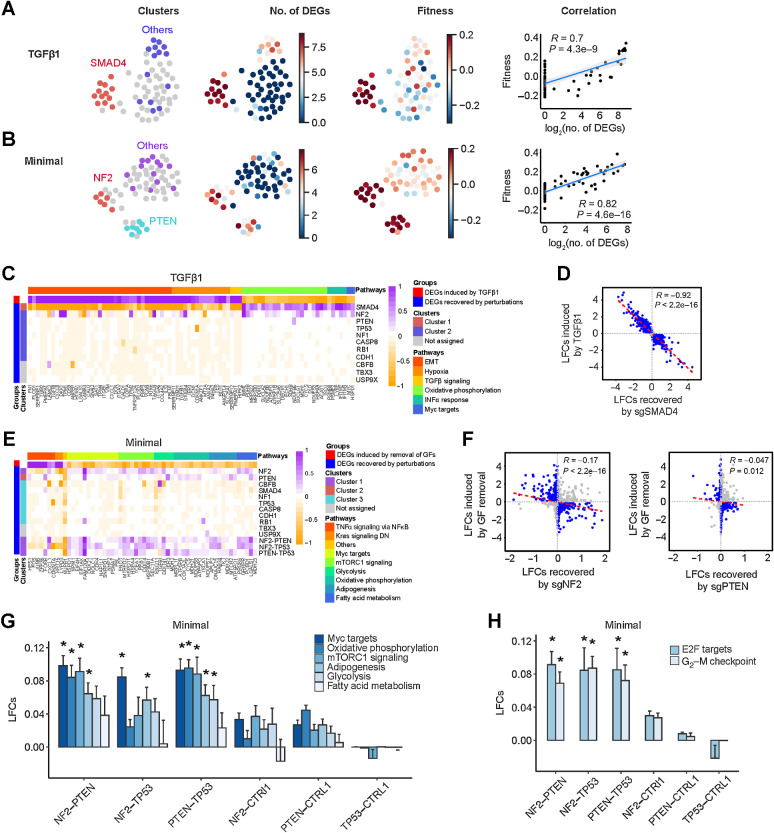
Figure 5. Single-cell transcriptional analysis reveals growth-promoting mechanisms underlying TSG perturbations. A and B, Relationship between transcriptional states and fitness in TGFβ1 and minimal medium, respectively. First column, UMAP projection of mean expression profiles for all the perturbations where transcriptionally similar clusters are highlighted in an identical color; second column, number of significant DEGs induced by each perturbation; third column, fitness measurements of each unique perturbation; and fourth column, correlation between fitness and number of significant DEGs. C, Representative DEGs in different biological pathways induced by TGFβ1 and recovered by the 11 SKO dual sgRNAs. EMT, epithelial–mesenchymal transition. D, Scatter plot of TGFβ1-induced LFCs and LFCs recovered by sgSMAD4. Genes with LFCs > 0.1 are highlighted in blue. E, DEGs in different biological pathways induced by growth factor (GF) deprivation and recovered by the 11 SKO and 3 DKO dual sgRNAs. DN, down. F, Scatter plots of growth factor withdrawal–induced LFCs and LFCs recovered by sgNF2 and sgPTEN. Genes with LFCs > 0.1 are highlighted in blue. G and H, Comparison of gene expression pathways involved in growth factor independence and cell cycle induced by sgNF2, sgPTEN, and sgTP53 and their dual combinations. Data are presented as mean ± SEM. *, P < 0.05; one-sided Student t test.

Single-cell transcriptional analysis reveals growth-promoting mechanisms underlying TSG perturbations. A and B, Relationship between transcriptional states and fitness in TGFβ1 and minimal medium, respectively. First column, UMAP projection of mean expression profiles for all the perturbations where transcriptionally similar clusters are highlighted in an identical color; second column, number of significant DEGs induced by each perturbation; third column, fitness measurements of each unique perturbation; and fourth column, correlation between fitness and number of significant DEGs. C, Representative DEGs in different biological pathways induced by TGFβ1 and recovered by the 11 SKO dual sgRNAs. EMT, epithelial–mesenchymal transition. D, Scatter plot of TGFβ1-induced LFCs and LFCs recovered by sgSMAD4. Genes with LFCs > 0.1 are highlighted in blue. E, DEGs in different biological pathways induced by growth factor (GF) deprivation and recovered by the 11 SKO and 3 DKO dual sgRNAs. DN, down. F, Scatter plots of growth factor withdrawal–induced LFCs and LFCs recovered by sgNF2 and sgPTEN. Genes with LFCs > 0.1 are highlighted in blue. G and H, Comparison of gene expression pathways involved in growth factor independence and cell cycle induced by sgNF2, sgPTEN, and sgTP53 and their dual combinations. Data are presented as mean ± SEM. *, P < 0.05; one-sided Student t test.