
Figure 2.
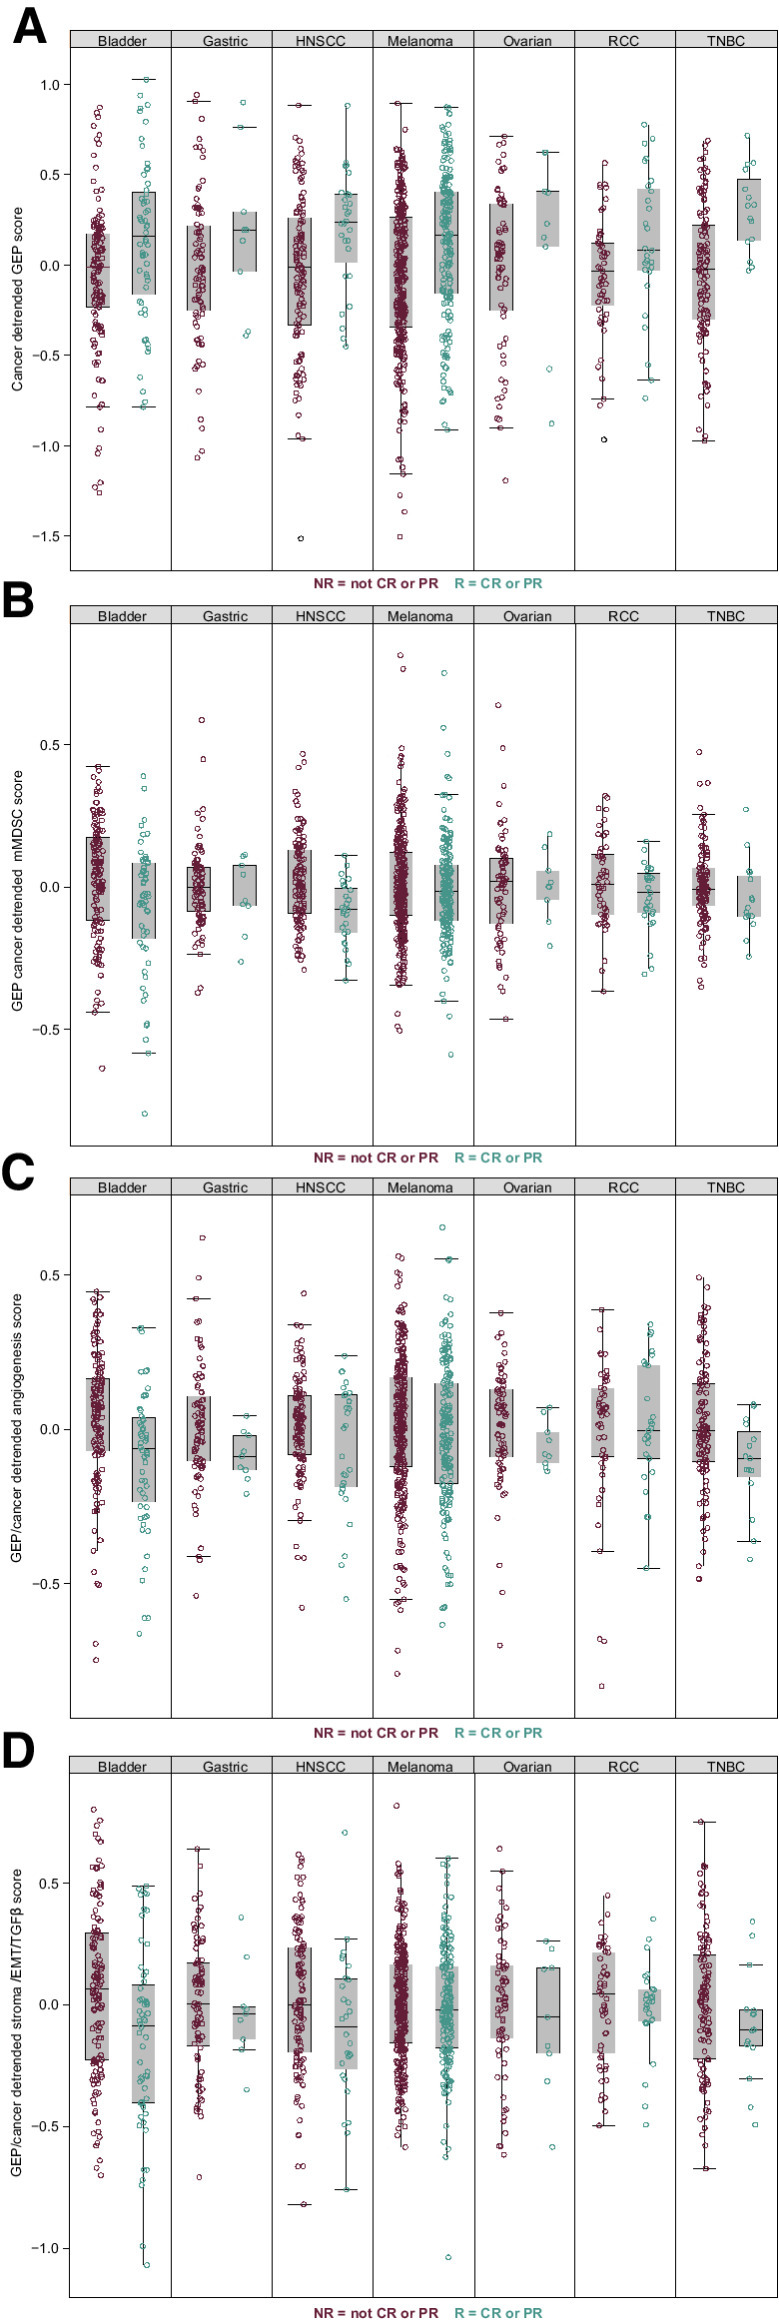
Associations of gene signatures with response to pembrolizumab across tumor types. T-cell–inflamed GEP (A), mMDSC (B), angiogenesis (C), and stroma/EMT/TGFβ signatures (D). CR, complete response; EMT, epithelial-to-mesenchymal transition; GEP, gene expression profile; HNSCC, head and neck squamous cell carcinoma; mMDSC, monocytic myeloid-derived suppressor cells; NR, nonresponder; PR, partial response; R, responder; RCC, renal cell carcinoma; TGFβ, transforming growth factor β; TNBC, triple-negative breast cancer.