. 2021 Nov 17;12(2):388–401. doi: 10.1158/2159-8290.CD-21-0410

Figure 2.

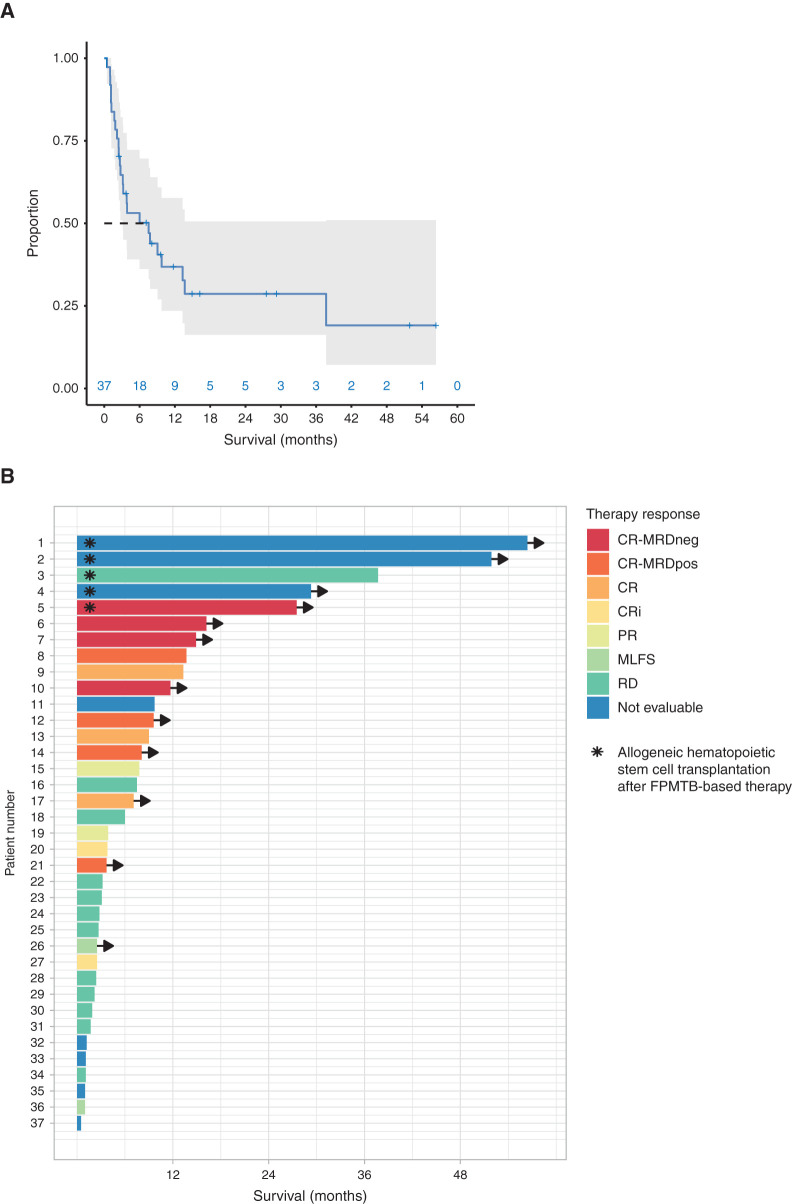
Figure 2. The outcome of patients treated with FPMTB-guided personalized therapies. A, The overall survival estimated by the Kaplan–Meier method of all patients (gray area denotes 95% confidence interval). B, Swimmer plot illustrates survival and therapy responses in 37 patients with R/R AML upon FPMTB-guided therapies, where the asterisk represents patients who received allogeneic hematopoietic stem cell transplantation after the treatment, and arrows represent the patients who are alive. The zero month represents the starting time point of the FPMTB-recommended therapy. The therapy responses—CR-MRDneg, complete response with minimal residual disease negative; CR-MRDpos, complete response with minimal residual disease positive; CR, complete remission; CRi, complete remission with incomplete hematologic recovery; PR, progressive disease; MLFS, bone marrow blasts <5%; RD, resistant disease—were defined by ELN-2017 criteria.

The outcome of patients treated with FPMTB-guided personalized therapies. A, The overall survival estimated by the Kaplan–Meier method of all patients (gray area denotes 95% confidence interval). B, Swimmer plot illustrates survival and therapy responses in 37 patients with R/R AML upon FPMTB-guided therapies, where the asterisk represents patients who received allogeneic hematopoietic stem cell transplantation after the treatment, and arrows represent the patients who are alive. The zero month represents the starting time point of the FPMTB-recommended therapy. The therapy responses—CR-MRDneg, complete response with minimal residual disease negative; CR-MRDpos, complete response with minimal residual disease positive; CR, complete remission; CRi, complete remission with incomplete hematologic recovery; PR, progressive disease; MLFS, bone marrow blasts <5%; RD, resistant disease—were defined by ELN-2017 criteria.