. 2021 Nov 17;12(1):90–107. doi: 10.1158/2159-8290.CD-21-0030

Figure 4.

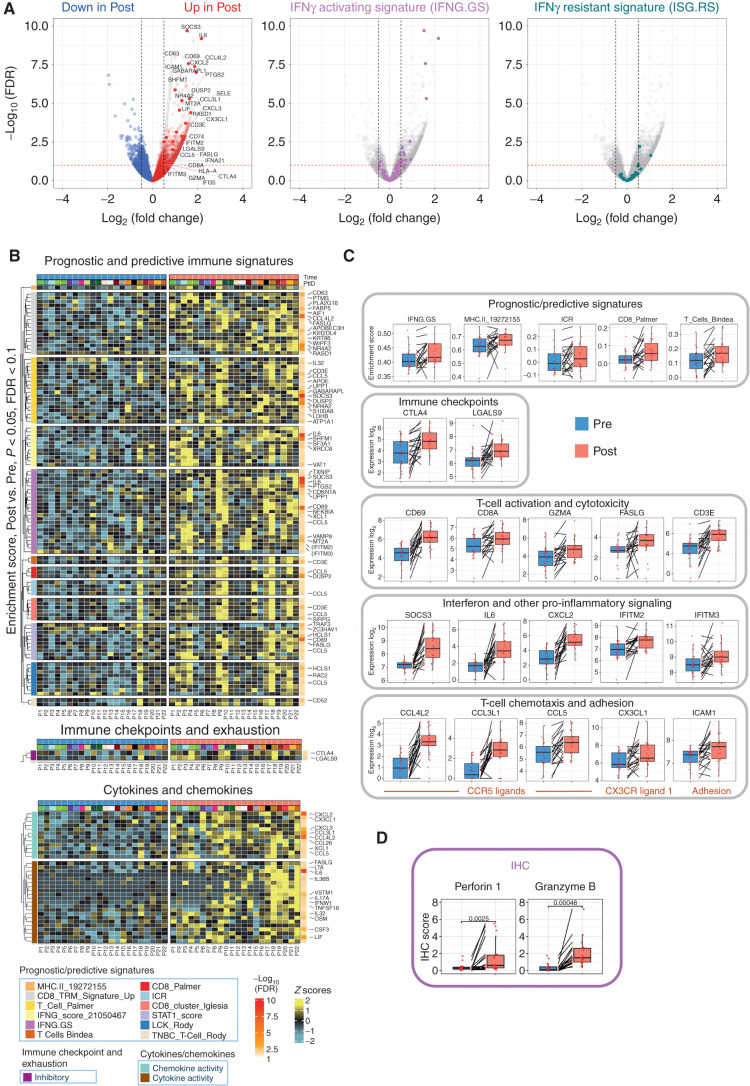
Figure 4. Intratumor transcriptomic changes induced by fasting-mimicking diet (FMD). A, Volcano plots displaying differentially expressed genes comparing post-FMD (T3) versus pre-FMD (T1) gene-level RNA-seq data using negative binomial distribution (Deseq2 package). Benjamini–Hochberg (B-H) false discovery rate (FDR) and Log2 fold change are represented. Left, red and blue colors are used to display upregulated and downregulated transcripts in post-FMD versus pre-FMD tumors, respectively; immune-related genes (see Methods and Supplementary Table S10) are colored in dark red (upregulated in post-FMD versus pre-FMD comparison) and dark blue (downregulated in post-FMD versus pre-FMD comparison); all the immune-related genes with −log10 FDR > 2.5 are labeled; additional representative immune-related genes with −log10 FDR > 1 are labeled; in the middle and left panels, transcripts belonging to the IFN-activating signature (IFNG.GS) and IFN-resistant signature (ISG.RS) are colored in purple and green, respectively. Volcano plot y-axis is truncated at −log10 FDR = 10, as no immune-related genes above that cutoff were present. B, Heat maps representing differentially expressed genes in post-FMD (T3, surgical samples) versus pre-FMD (T1, tumor biopsies) comparisons; the top panel displays genes with P < 0.05 (Wilcoxon test) and B-H FDR < 0.1 at differential gene expression analysis and included in any of the significantly modulated (P < 0.05 and B-H FDR < 0.1) prognostic/predictive signatures at single-sample gene set enrichment analysis (of the 25 evaluated prognostic/predictive signatures, 13 were significantly enriched in post-FMD vs. pre-FMD tumor samples, but one of them did not yield any differentially expressed genes, therefore only 12 signatures are represented in the heat map; Supplementary Table S10); the middle panel displays genes with P < 0.05 (Wilcoxon test) and B-H FDR < 0.1 at differential gene expression analysis and included in the exhaustion and immune checkpoint list (Supplementary Table S10); the bottom panel displays genes with P < 0.05 and B-H FDR < 0.1 at differential gene expression analysis and included in the cytokine/chemokine gene list (Supplementary Table S10). In the heat maps, all genes with B-H FDR < 0.05 are labeled, in addition with other selected genes (in brackets) with FDR between 0.1 and 0.05. C, Box plots of representative prognostic/predictive signature enrichment scores and transcripts with P < 0.05 and B-H FDR < 0.1 in the post-FMD (T3) versus pre-FMD (T1) comparison. D, Box plots of Perforin 1 and Granzyme B IHC scores in post-FMD (T3) versus pre-FMD (T1) tumors (n = 17 and n = 16, respectively).

Intratumor transcriptomic changes induced by fasting-mimicking diet (FMD). A, Volcano plots displaying differentially expressed genes comparing post-FMD (T3) versus pre-FMD (T1) gene-level RNA-seq data using negative binomial distribution (Deseq2 package). Benjamini–Hochberg (B-H) false discovery rate (FDR) and Log2 fold change are represented. Left, red and blue colors are used to display upregulated and downregulated transcripts in post-FMD versus pre-FMD tumors, respectively; immune-related genes (see Methods and Supplementary Table S10) are colored in dark red (upregulated in post-FMD versus pre-FMD comparison) and dark blue (downregulated in post-FMD versus pre-FMD comparison); all the immune-related genes with −log10 FDR > 2.5 are labeled; additional representative immune-related genes with −log10 FDR > 1 are labeled; in the middle and left panels, transcripts belonging to the IFN-activating signature (IFNG.GS) and IFN-resistant signature (ISG.RS) are colored in purple and green, respectively. Volcano plot y-axis is truncated at −log10 FDR = 10, as no immune-related genes above that cutoff were present. B, Heat maps representing differentially expressed genes in post-FMD (T3, surgical samples) versus pre-FMD (T1, tumor biopsies) comparisons; the top panel displays genes with P < 0.05 (Wilcoxon test) and B-H FDR < 0.1 at differential gene expression analysis and included in any of the significantly modulated (P < 0.05 and B-H FDR < 0.1) prognostic/predictive signatures at single-sample gene set enrichment analysis (of the 25 evaluated prognostic/predictive signatures, 13 were significantly enriched in post-FMD vs. pre-FMD tumor samples, but one of them did not yield any differentially expressed genes, therefore only 12 signatures are represented in the heat map; Supplementary Table S10); the middle panel displays genes with P < 0.05 (Wilcoxon test) and B-H FDR < 0.1 at differential gene expression analysis and included in the exhaustion and immune checkpoint list (Supplementary Table S10); the bottom panel displays genes with P < 0.05 and B-H FDR < 0.1 at differential gene expression analysis and included in the cytokine/chemokine gene list (Supplementary Table S10). In the heat maps, all genes with B-H FDR < 0.05 are labeled, in addition with other selected genes (in brackets) with FDR between 0.1 and 0.05. C, Box plots of representative prognostic/predictive signature enrichment scores and transcripts with P < 0.05 and B-H FDR < 0.1 in the post-FMD (T3) versus pre-FMD (T1) comparison. D, Box plots of Perforin 1 and Granzyme B IHC scores in post-FMD (T3) versus pre-FMD (T1) tumors (n = 17 and n = 16, respectively).