. 2021 Oct 11;12(2):372–387. doi: 10.1158/2159-8290.CD-21-0538

Figure 3.

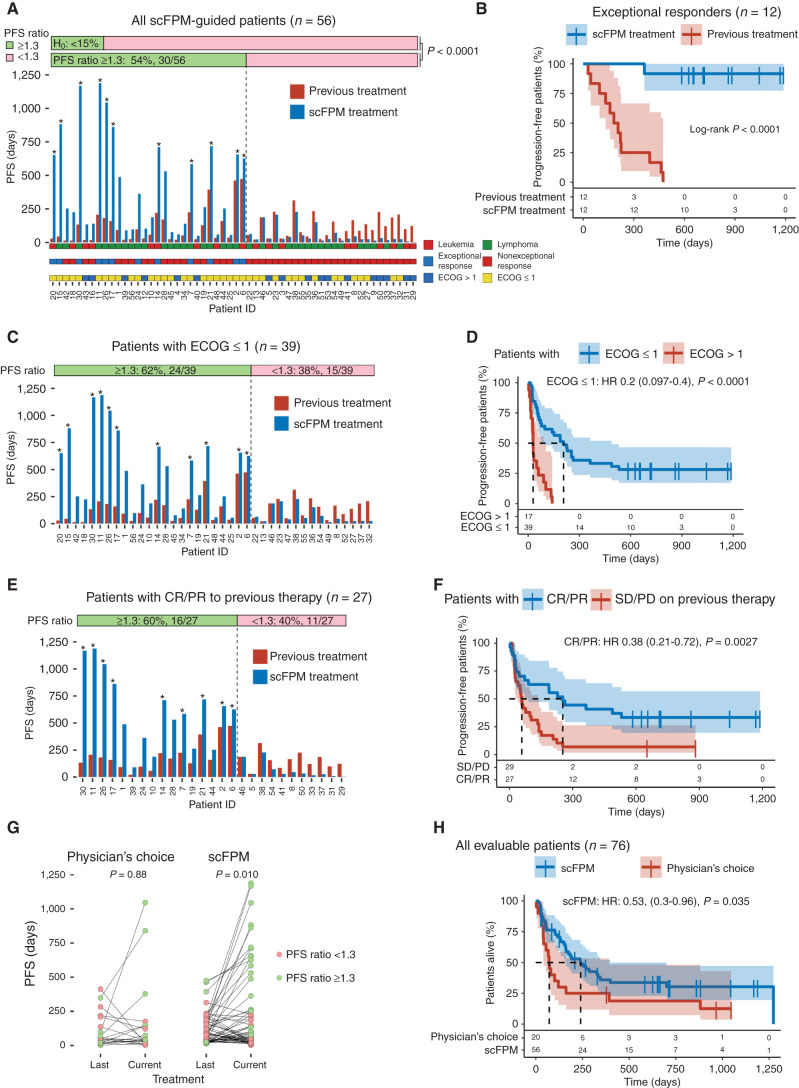
Figure 3. scFPM-guided treatment enhances PFS ratio in patients with advanced hematologic cancers and provides a survival benefit. A, Bar plot showing the PFS for all included, scFPM-guided patients: blue bars denote PFS in days for scFPM-guided treatment, red bars indicate last previous treatment, and asterisks denote ongoing response for scFPM treatment at the censoring date. PFS ratio is the following ratio: PFS(scFPM treatment)/PFS(previous treatment). Patient characteristics are color coded and stratified (leukemia vs. lymphoma, exceptional response vs. nonexceptional response, ECOG >1 vs. ECOG ≤1). B, Kaplan–Meier plot comparing PFS on scFPM-guided treatment with previous treatment in exceptional responders (n = 12). C, Bar plot showing PFS for all patients with an ECOG ≤1 (n = 39). Asterisks denote ongoing response for scFPM treatment at censoring date. D, Kaplan–Meier plot comparing PFS on scFPM treatment between patients with ECOG ≤1 (n = 39) versus ECOG>1 (n = 17). E, Bar plot showing PFS for all patients with OR on previous treatment. Asterisks denote ongoing response for scFPM treatment at censoring date. F, Kaplan–Meier plot comparing PFS on scFPM treatment stratified according to OR on last treatment (CR/PR: n = 27, SD/PD: n = 29). G, Scatter plot comparing PFS on last treatment to current treatment, for scFPM-guided versus physician's choice patients (paired Wilcoxon test). H, Kaplan–Meier plot comparing overall survival stratified according to scFPM-guided patients (n = 56) versus physician's choice patients (n = 20).

scFPM-guided treatment enhances PFS ratio in patients with advanced hematologic cancers and provides a survival benefit. A, Bar plot showing the PFS for all included, scFPM-guided patients: blue bars denote PFS in days for scFPM-guided treatment, red bars indicate last previous treatment, and asterisks denote ongoing response for scFPM treatment at the censoring date. PFS ratio is the following ratio: PFS(scFPM treatment)/PFS(previous treatment). Patient characteristics are color coded and stratified (leukemia vs. lymphoma, exceptional response vs. nonexceptional response, ECOG >1 vs. ECOG ≤1). B, Kaplan–Meier plot comparing PFS on scFPM-guided treatment with previous treatment in exceptional responders (n = 12). C, Bar plot showing PFS for all patients with an ECOG ≤1 (n = 39). Asterisks denote ongoing response for scFPM treatment at censoring date. D, Kaplan–Meier plot comparing PFS on scFPM treatment between patients with ECOG ≤1 (n = 39) versus ECOG>1 (n = 17). E, Bar plot showing PFS for all patients with OR on previous treatment. Asterisks denote ongoing response for scFPM treatment at censoring date. F, Kaplan–Meier plot comparing PFS on scFPM treatment stratified according to OR on last treatment (CR/PR: n = 27, SD/PD: n = 29). G, Scatter plot comparing PFS on last treatment to current treatment, for scFPM-guided versus physician's choice patients (paired Wilcoxon test). H, Kaplan–Meier plot comparing overall survival stratified according to scFPM-guided patients (n = 56) versus physician's choice patients (n = 20).