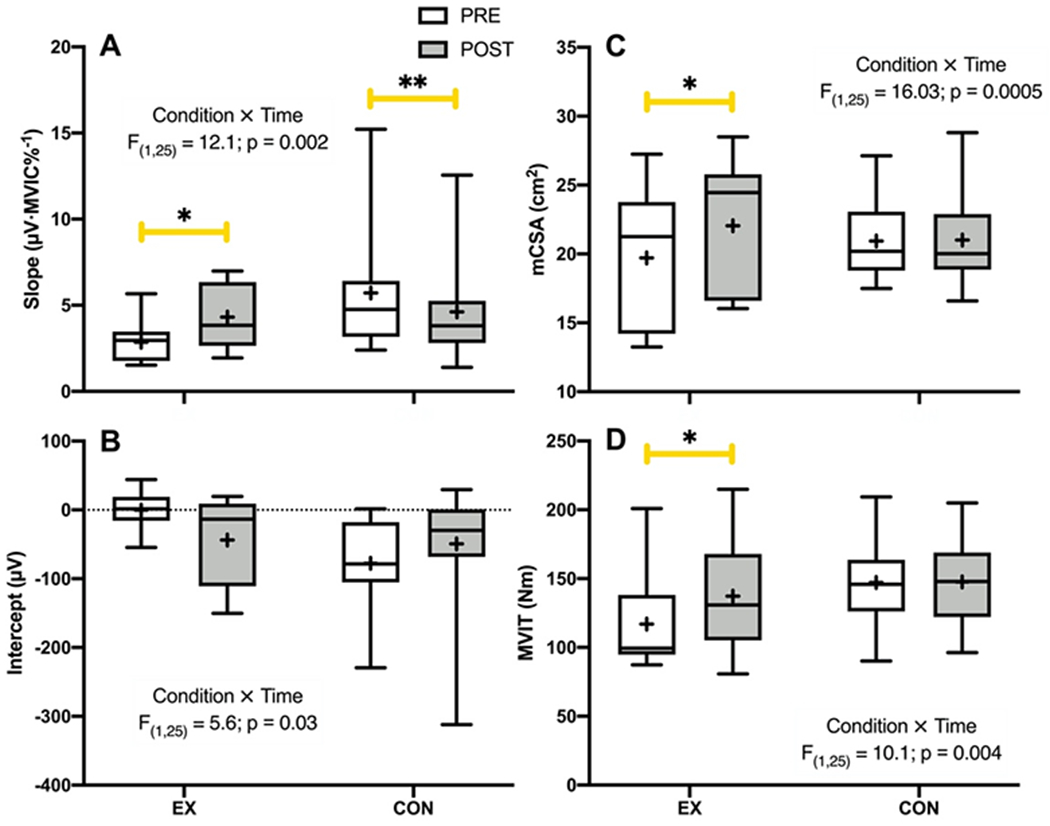
Figure 1.

Box and whisker plots depicting the pre- (PRE) to post-intervention (POST) changes in (A) motor unit action potential amplitude versus normalized recruitment threshold (MUAPAMP-RTNORM) slope, (B) MUAPAMP-RTNORM intercept, (C) vastus lateralis muscle cross sectional area (mCSA), and (D) maximal voluntary isometric torque (MVIT) for the exercise (EX) and control (CON) groups. The middle horizontal line of the box represents the median, the lower and upper horizontal lines of the box represent the interquartile range (i.e., 1st and 3rd quartiles), the small cross represents the mean, and the whiskers depict the range. *indicates a significant increase from PRE to POST (p ≤ 0.04); **indicates a significant decrease from PRE to POST (p = 0.03).
