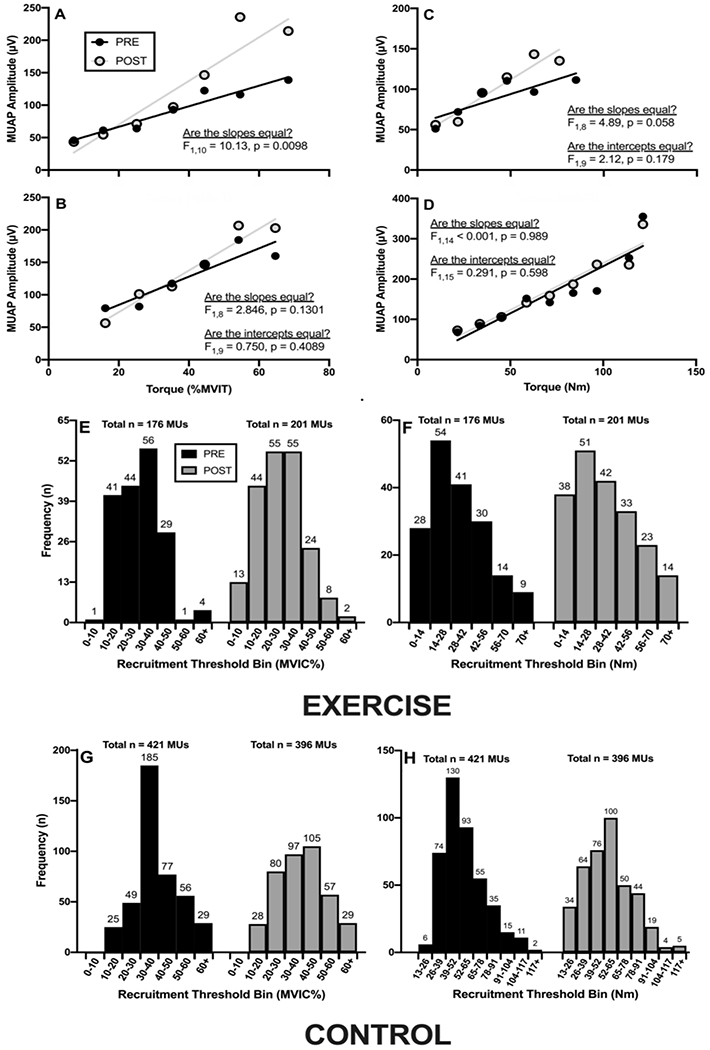
Figure 2.

The pooled motor unit action potential (MUAP) amplitude versus normalized and absolute recruitment threshold (RT) relationships before (PRE) and after (POST) the intervention period in the exercise (panels A and C, respectively) and control (panels B and D, respectively) groups. Panels E-H depict the number and distribution of the MUs utilized in the pooled analyses.
