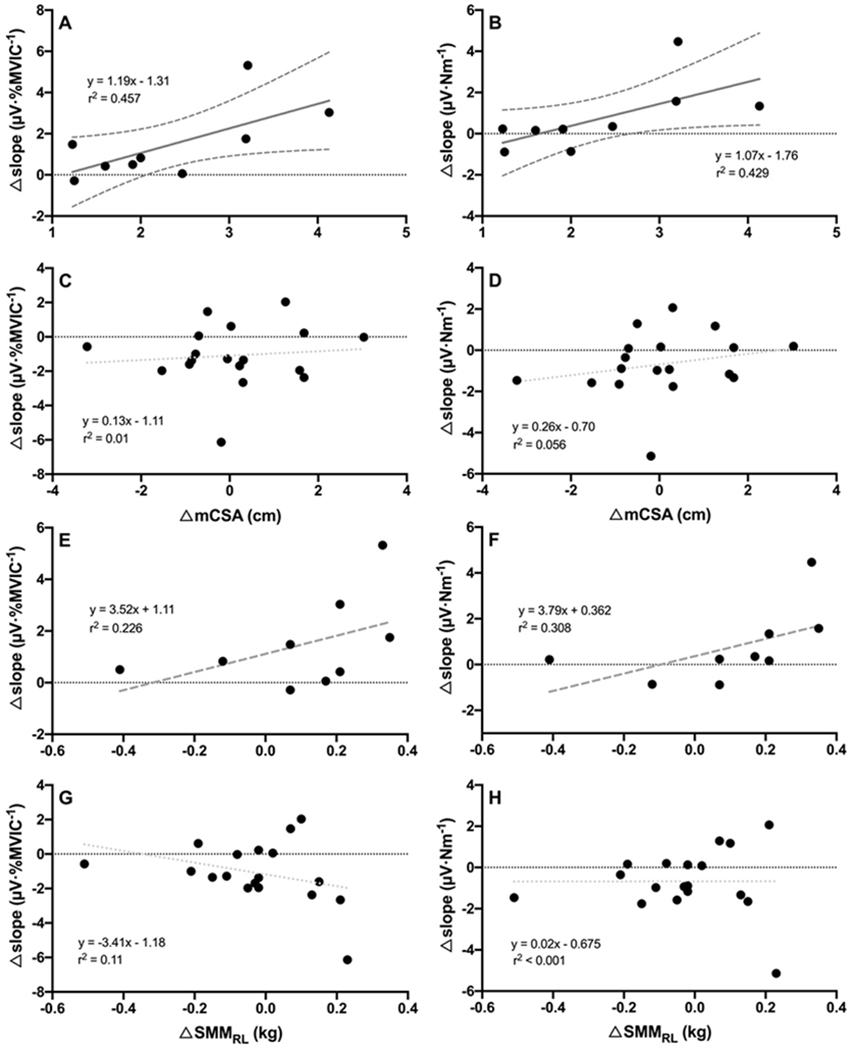
Figure 3.

Panels A-D depict the relationships among each subject’s change in MUAPAMP-RTNORM slope and change in MUAPAMP-RTABS slope versus change in mCSA in the (A and B) EX group and (C and D) CON group. Panels E-H depict the relationships among each subject’s change in MUAPAMP-RTNORM slope and change in MUAPAMP-RTABS slope versus change in whole leg skeletal muscle mass (SMMRL) in the (E and F) EX group and (G and H) CON group. Solid dark grey regression lines (with 95% confidence intervals) indicate a strong, significant relationship. Dashed dark grey regression lines indicate a moderate to strong, but non-significant relationship (0.05 > p ≤ 0.10). Dotted light grey lines indicate small, non-significant relationships.
