Figure 1.
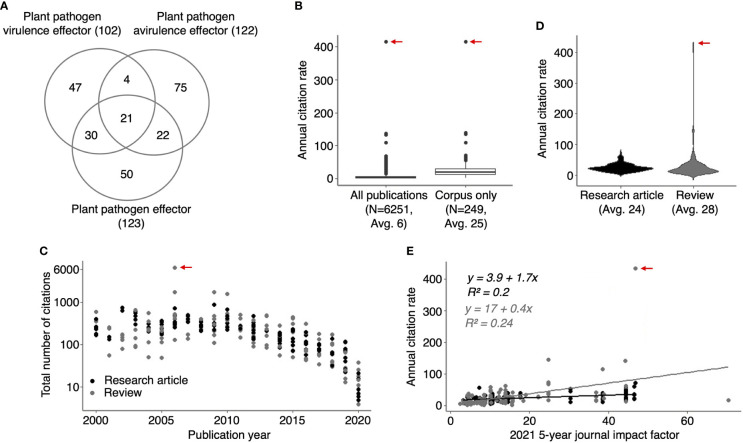
HIPEs are highly cited studies addressing plant pathogen effectors. (A) Venn diagram indicating the number of overlapping publications between the three groups of keywords (‘plant pathogen effectors’, ‘plant pathogen avirulence effectors’ and ‘plant pathogen virulence effectors’) used to build the HIPE collection. The number of publications is shown between parentheses. (B) Boxplots displaying the annual citation rate (i.e., average number of citations per year) of all publications identified with the keyword searches (left-hand side; ‘All publications’) and the HIPEs only (right-hand side; ‘Corpus only’). The boxplot outliers are indicated as dots. The number of publications and the average of annual citation rate for publications considered is indicated below each boxplot (N and Avg value, respectively). (C) Scatterplot displaying the number of total citations of individual HIPEs according to their publication year. The total number of citation value was extracted from Web of Science portal (accessed in July 2021). (D) Violin plots displaying the annual citation rate of HIPE research articles and reviews. The average of annual citation rate for publications considered is indicated below each violin plot (Avg value). (E) Scatterplot displaying the annual citation rate of individual HIPEs according to the value of the 2021 5-year journal impact factor (‘current five-years journal impact factor’ on the Web Of Science portal) of the journal in which the HIPEs were published. Black and grey dots indicate research articles and reviews, respectively. Linear trendlines are indicated for each article type along with trendline equations and r-squared values, with the same color-code as previously. In (B-E) the red arrow indicates the HIPE with the highest annual citation rate, which corresponds to the 2006 review by Jones and Dangl that presented the zig-zag model of the plant immune system. The raw data used to build this figure are available in the Dataset 1 .

