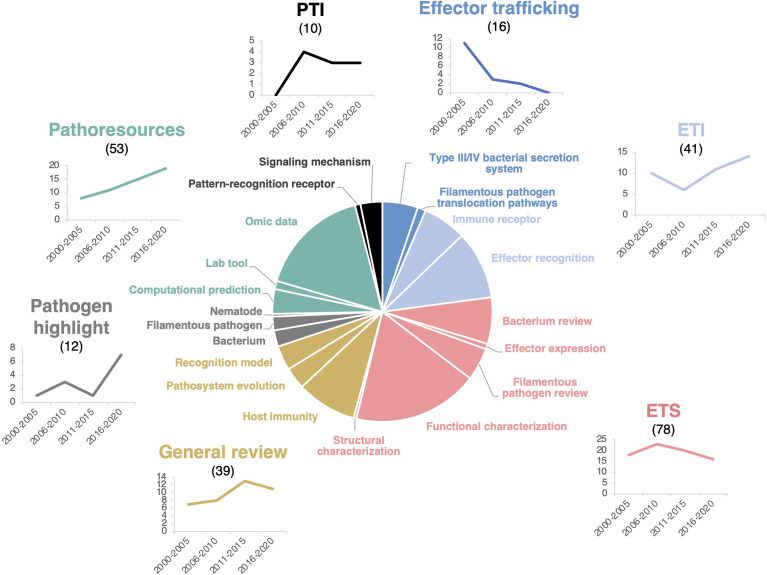
Figure 2.
HIPEs pertain to seven main research topics. Pie chart displaying the seven main research topics and 20 sub-topics addressed by the HIPEs and their publication trends over time. The main research topics, sub-topics, and trendlines associated are color-coded as indicated in Figure S3 . Sub-topics are indicated as separated pie segments within a main topic. The categorization of each HIPE was based on iterative expert reading and keyword association of the entire HIPE collection. Numbers above the main research topics indicate the total number of HIPEs for each topic. Trendlines indicate the number of HIPEs for each topic according to one six-year time frame (low number of publications during this frame) and four five-year time frames: 2000-2005, 2006-2010, 2011-2015, and 2016-2020, respectively. PTI: Pattern-triggered immunity; ETI: Effector-triggered immunity; ETS: Effector-triggered susceptibility. The percentage of reviews within each topics is as follow: effector trafficking (63%), ETI (27%), ETS (42%), general reviews (100%), pathogen highlight (100%), pathoresources (21%), and PTI (60%). The raw data used to build this figure are available in the Dataset 1 .

