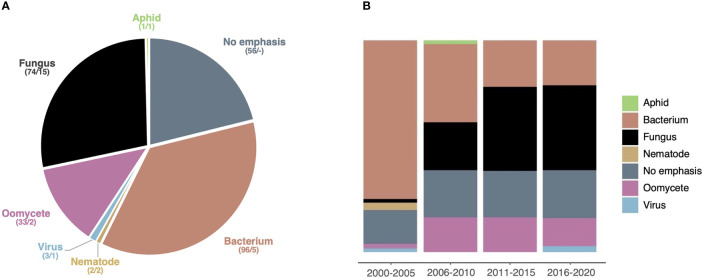
Figure 5.
Studies emphasizing fungi gain importance over time. (A) Pie chart displaying the seven taxonomic groups of pathogens emphasized (if any) addressed by the HIPEs. The assignment of each HIPE was based on iterative expert reading of the publications. For each taxonomic group, the number of HIPEs and the total number of species are indicated (e.g. ‘74/15’). (B) Percent stacked bar chart displaying the evolution of the relative size of taxonomic groups over one six-year time frame (low number of publications during this frame) and four five-year time: 2000-2005, 2006-2010, 2011-2015, and 2016-2020, respectively. Color code is the same as in (A). The raw data used to build this figure are available in the Dataset 1 .

