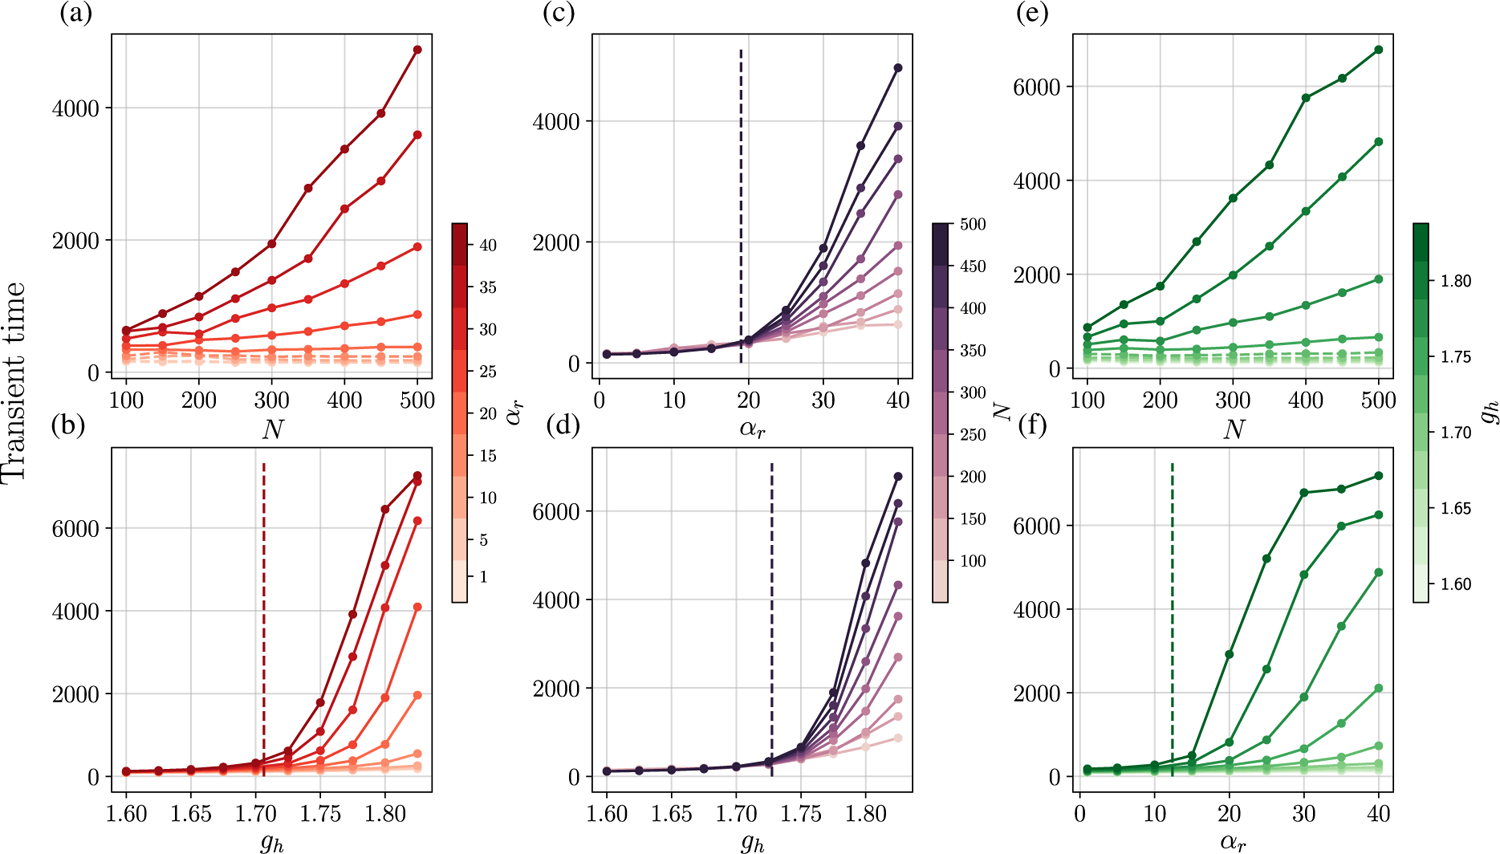
FIG. 11.

Transient times at the bifurcation transition. Transient times (τT, relative to τh) as a function of gh, αr, and system size N. Dashed plot lines correspond to situations where . Dashed vertical lines are critical values of αr or gh. (a) τT vs N for gh = 1.775 and (b) τT vs gh for N = 500; the dashed line indicates gh such that . (c) τT vs αr for gh = 1.775; the dashed vertical line is . (d) τT vs gh for αr = 30; the dashed line is gh such that . (e) τT vs N for αr = 30; dashed plot lines correspond to situations where . (f) τT vs αr for N = 500; the dashed vertical line is . Transient times are averaged over 2000 instances of random networks.
