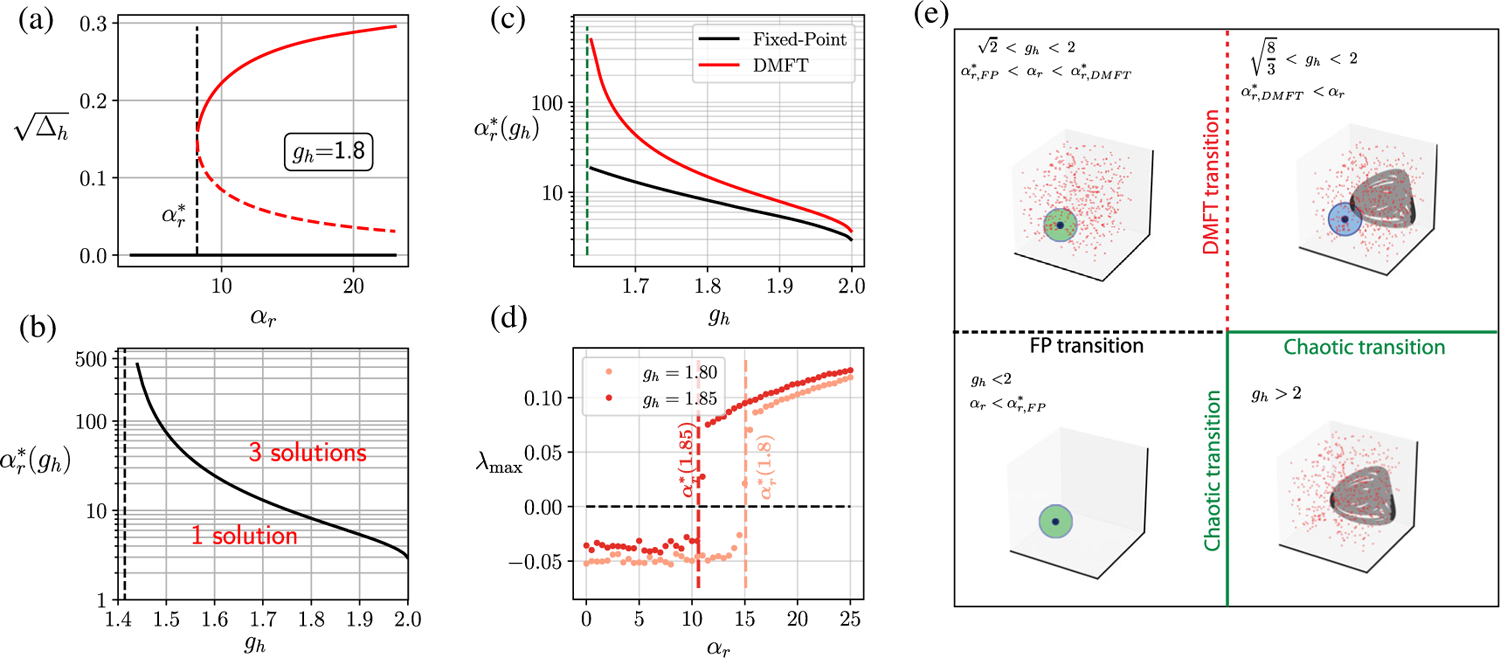
FIG. 4.

The discontinuous dynamical transition. (a) Spontaneous appearance of nonzero solutions (dashed and solid red lines) to the FP equations once αr crosses a critical value at fixed gh. (b) The critical as a function of gh. The vertical dashed line represents left critical value , below which a bifurcation is not possible. (c) The critical DMFT transition curve (red curve) calculated using Eqs. (G8) and (G9). The FP transition curve from (b) is shown in black. The green dashed line corresponds to , below which the dynamical transition is not possible. (d) Numerically calculated maximum Lyapunov exponent λmax as a function of αr for two different values of gh. The dashed lines correspond to the DMFT prediction for the discontinuous transition from (c). (e) Schematic of the bifurcation transition: For gh < 2 and , the zero FP is the only (stable) solution (bottom left box); for and , the zero FP is still stable, but there is a proliferation of unstable FPs without any obvious dynamical signature (top left); for and , chaotic dynamics coexist with the stable FP and this transition is discontinuous (top right); finally, for gh > 2.0, the stable FP becomes unstable, and only the chaotic attractor remains; this transition is continuous (bottom right).
