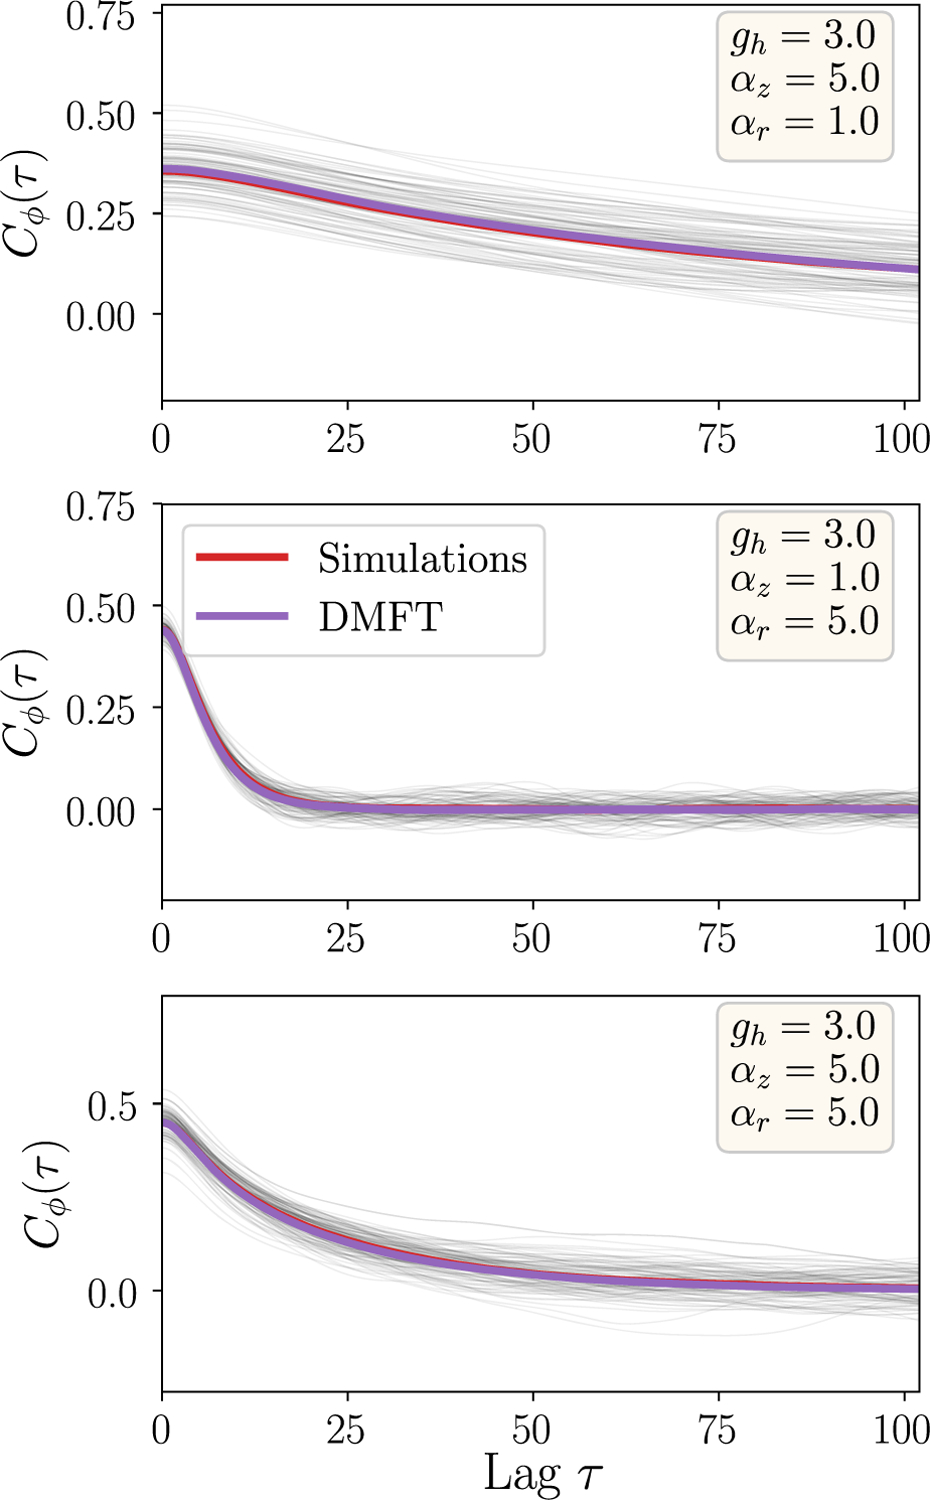
FIG. 9.

Validating the DMFT. We show the comparison between the population-averaged correlation functions Cϕ(τ) ≡ 〈ϕ(t)ϕ(t + τ)〉 obtained from the full network simulations of a single instantiation in steady state (purple line) and from solving the DMFT equations (red line) for three distinct parameter values. The lag τ is relative to τh (taken to be unity). Thin black lines are the time-averaged correlation functions for individual neurons sampled from the network, to show the scale of fluctuations around the population-averaged correlation functions. N = 5000 for all the panels.
