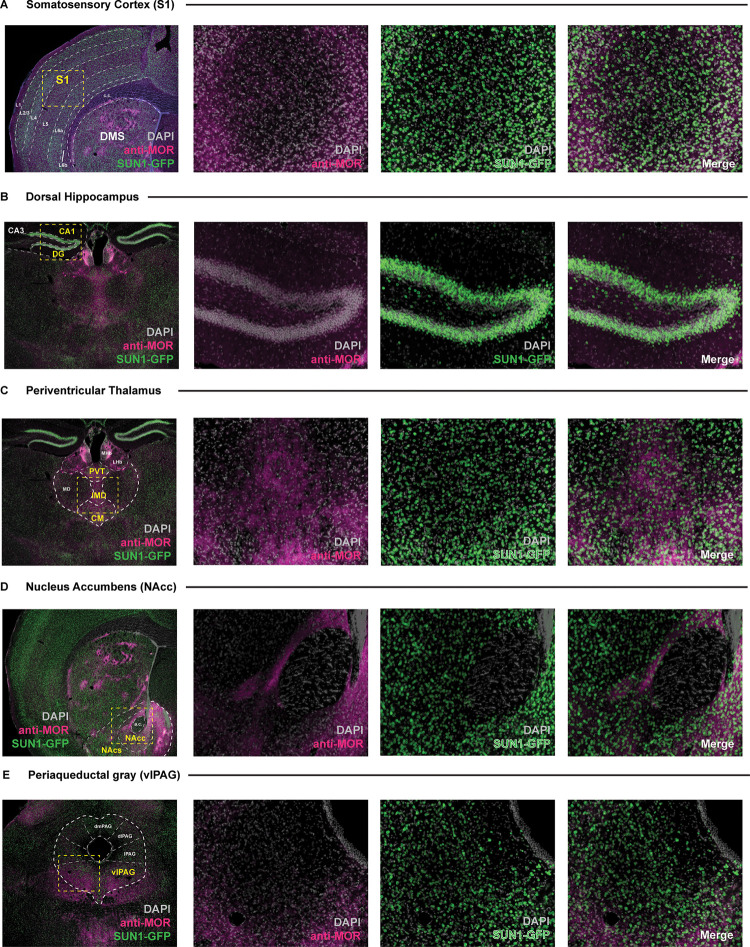
Fig 6. Overlap of SUN1-GFP expression from Oprm1Cre; RosaLSL-Sun1-sfGFP mice with mu opioid receptor (MOR) staining across multiple brain regions.
Low (4X) and higher (20X) magnification images of SUN1-GFP signal observed within the (A) somatosensory cortex, (B) dorsal hippocampus, (C) periventricular thalamus, (D) nucleus accumbens, and (E) periaqueductal gray in brain tissue sections taken from the Oprm1Cre; RosaLSL-Sun1-sfGFP mouse. High magnification images of sample areas within each section are denoted by boxed (yellow) regions within the low magnification images. Individual channels showing anti-MOR staining (pink) and SUN1-GFP (green) signal overlaying DAPI stained nuclei (gray) are displayed next to merged signal images. S1 = somatosensory cortex; L1-6b = cortical layers; CA1 = CA1 division of the hippocampus; CA3 = CA3 division of the hippocampus; DG = dentate gyrus of the hippocampus; MHb = medial habenula; LHb = lateral habenula; PVT = periventricular thalamus; IMD = interomediodorsal thalamus; CM = central medial thalamus; MD = mediodorsal thalamus; NAcc = nucleus accumbens core; NAcs = nucleus accumbens shell; dmPAG = dorsomedial periaqueductal gray; dlPAG = dorsolateral; l = lateral; vlPAG = ventrolateral; c.c. = corpus callosum; a.c. = anterior commissure.

