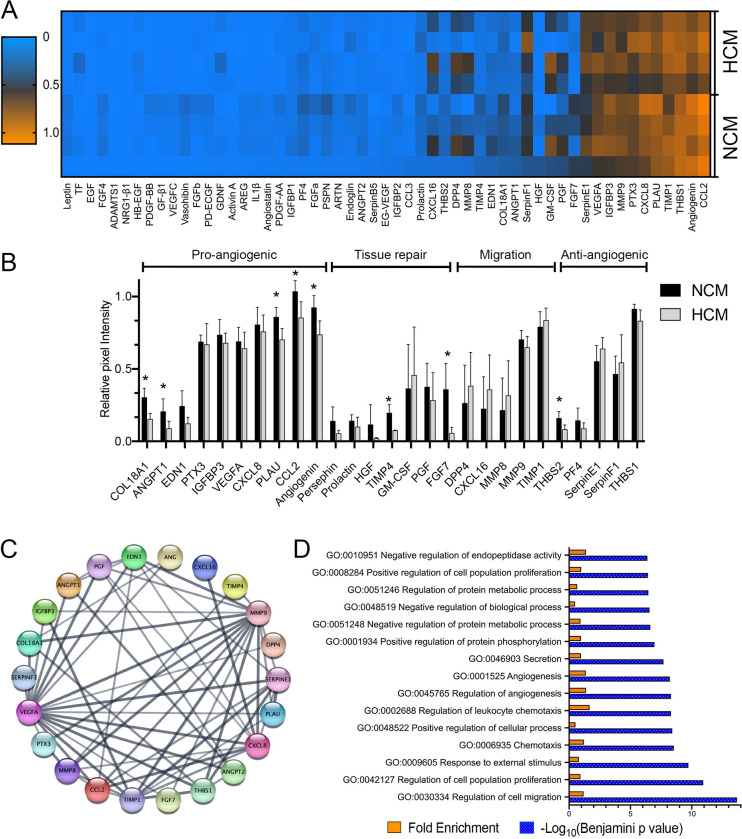
Fig 2. Characterization of HCM and NCM secretomes of human adipose mesenchymal stem cells (hASCs).
(A) Heatmap depicts the overall profile of 55 trophic factors, cytokines, and chemokines relative to protein abundance (mean pixel intensity). Each column represents a different protein, while each row represents a sample. (B) NCM and HCM were analyzed by antibody-based protein array kit. Values are normalized to positive reference spots. Data are representative of three independent experiments, and values are expressed in mean ± SD. (C) STRING analysis uncovering protein-protein interaction (PPI) network of most abundant trophic factors expressed in NCM and HCM visualized by Cytoscape. (D) David Gene Ontology analyses of proteins more abundant in hASC secretome. GO enrichment analysis showed the biological process of most representative trophic factors ranked by p-value. The top 15 processes were selected based on the Benjamini p-value (− Log10 Benjamini p-value are reported as blue bars). Fold enrichment is also reported as orange bars. * p<0.05. N = 8.

