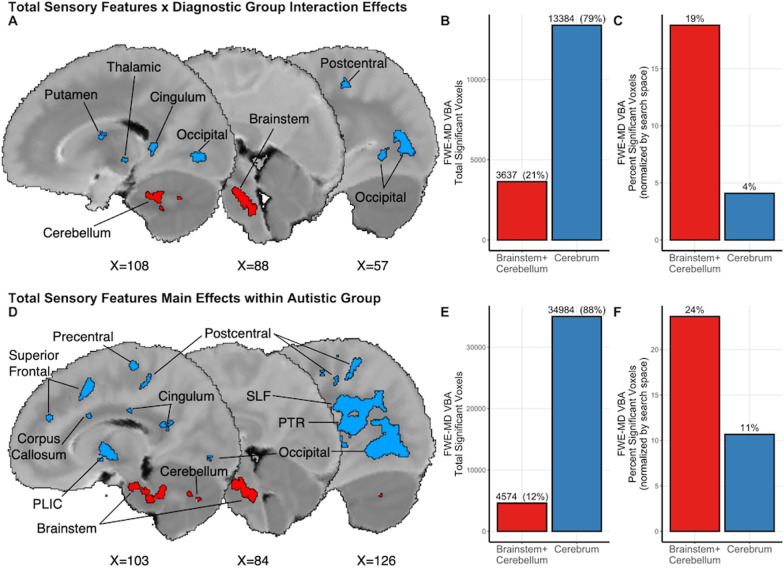
Fig. 4.
Regions with distinct sensory-microstructure relationships from whole-brain voxel-based analyses with autistic and non-autistic children. Brainstem + cerebellar white matter (red) and cerebral white matter (blue) voxels indicating a significant total sensory feature by diagnostic group interaction effects represented A spatially, B as a total count, and C normalized for search space (the number of possible voxels that could be found to be significantly associated with sensory features within each area). Voxels indicating a significant total sensory feature man effects within the autistic group represented D spatially, E as a total count, and F normalized for search space

