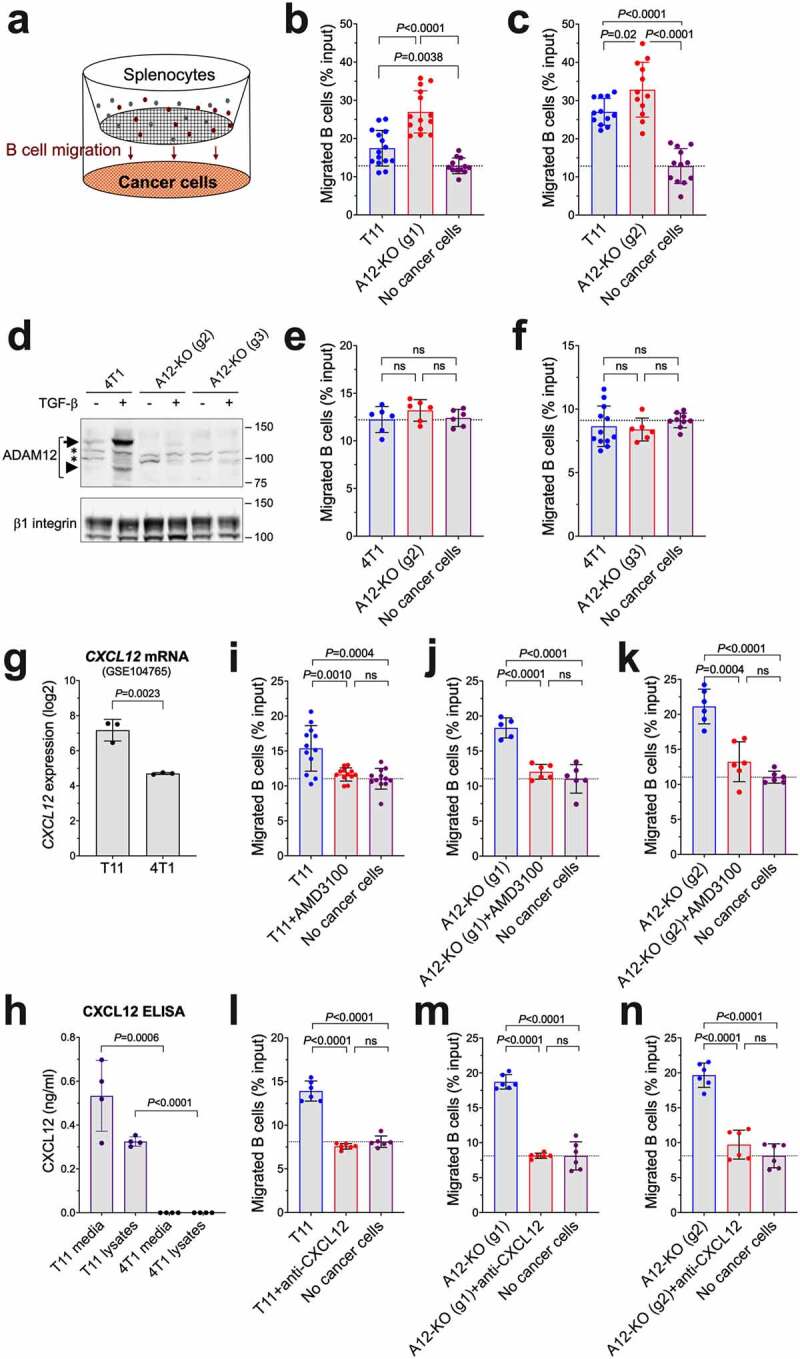
Figure 5.

The effect of ADAM12 loss in cancer cells on chemotaxis of B cells in vitro. (a) Schematic diagram of transwell B cell migration assays. B cell content among splenocytes seeded in upper chambers and B cells migrated after 4 hours into lower chambers toward cancer cells were measured by flow cytometry. (b, c) B cell migration toward wild-type T11 cells was compared to A12-KO (g1) T11 cells (b) or A12-KO (g2) cells (c). (d) Detection of ADAM12 by Western blotting in control 4T1 cells and in 4T1 cells in which Adam12 was knocked out using gRNA2 or gRNA3. Glycoprotein enrichment on concanavalin A agarose was as in Figures 1 and 4. Nascent and mature forms of ADAM12 are indicated with long and short arrows, respectively; non-specific bands are marked with asterisks, β1 integrin is gel loading control. (e, f) B cell migration toward wild-type 4T1 cells was compared to A12-KO (g2) 4T1 cells (e) or A12-KO (g3) cells (f). (g) Cxcl12 mRNA levels in T11 and 4T1 cell lines (ref. 18). The data were retrieved from GEO:GSE104765. (h) CXCL12 protein levels in conditioned media and in cell lysates from T11 and 4T1 cells were measured by ELISA. (i-k) Transwell B cell migration assays toward T11 cells (i), A12-KO (g1) (j), or A12-KO (g2) (k) were performed in the absence or presence of 10 μg/ml AMD3100, an inhibitor of CXCR4, added to the upper chambers. (l-n) Transwell B cell migration assays toward T11 cells (l), A12-KO (g1) (m), or A12-KO (g2) (n) were performed in the absence or presence of 2.5 µg/ml CXCL12-blocking antibody added to the lower chambers. For each panel, data were pooled from 2 to 5 independent experiments, each experiment included three different transwells per group. Gating strategies for B cell quantification are shown in Supplementary Figure S4.
