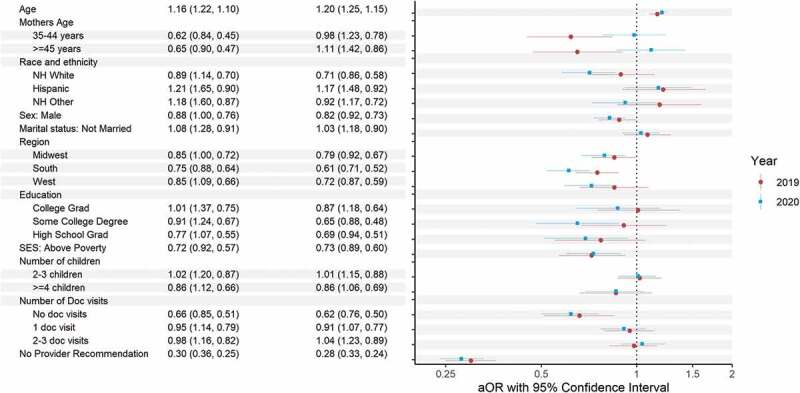
Figure 2.

Factors associated with human papillomavirus vaccine completion, 2019 and 2020 NIS-Teen.
Second column represents odds ratios (95% CI) for 2019 and third column odds ratios (95% CI) for 2020. The round symbol is the point estimate for 2019, and the square symbol is the point estimate for 2020.
NH = Non-Hispanic; NIS = National Immunization Survey.
