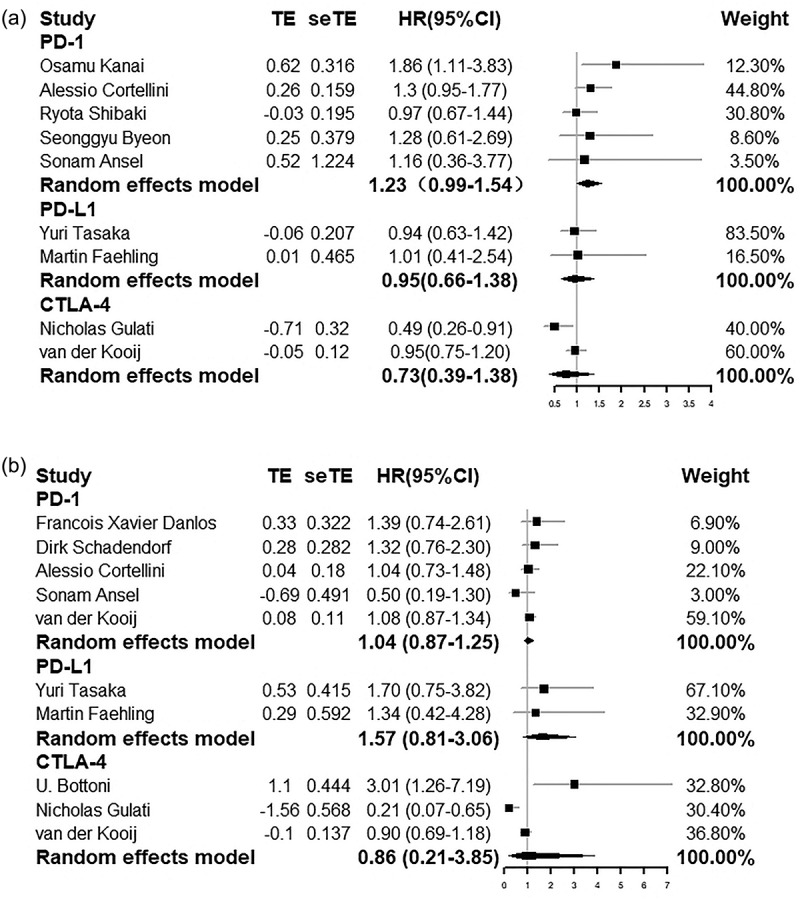
Figure 13.

Forest plots of PFS and OS in NSCLC using anti-PD-1 or in NSCLC using anti-PD-L1 or in melanoma using CTLA-4. (a) Forest plot of PFS in NSCLC using anti-PD-1 or in NSCLC using anti-PD-L1 or in melanoma using CTLA-4. (b) Forest plot of OS in NSCLC using anti-PD-1 or in NSCLC using anti-PD-L1 or in melanoma using CTLA-4.
