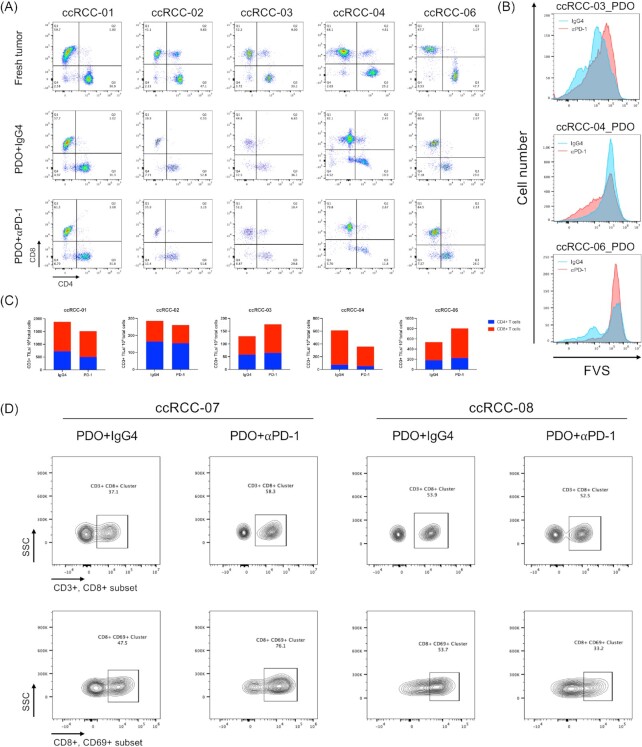
Figure 3.
PDOs recapitulate the response to immune checkpoint blockades. (A) FACS analysis of tumor infiltrated CD8+ and CD4+ T lymphocytes subpopulations in original tumors (top row), and PDOs after 7 days treatment of toripalimab (middle row) versus isotype IgG4 (bottom row); (B) FACS histogram plot of FVS stained tumor cells in PDOs received toripalimab (red line) or IgG4 (blue line) for 7 days; (C) FACS quantification of CD3+ TILs, CD4+, and CD8+ T lymphocytes subpopulations from (A); (D) FACS analysis of tumor infiltrated CD3+CD8+ T lymphocytes and CD8+CD69+ T lymphocytes in PDOs after 7 days treatment of toripalimab versus isotype IgG4. PDOs, patient-derived organoids; FACS, florescence-activated cell sorting; CD, cluster of differentiation; IgG, immunoglobulin-G.

