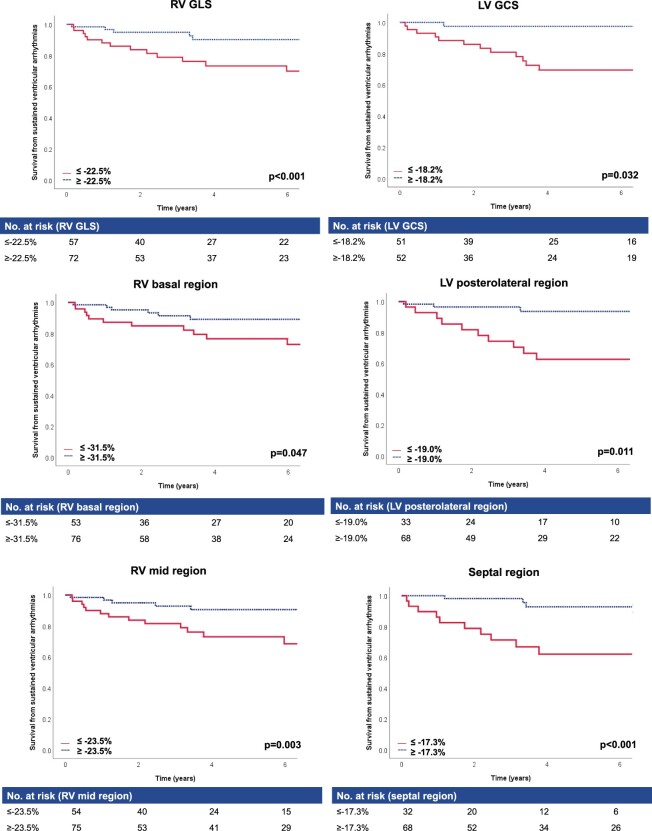
Figure 2.
Kaplan–Meier survival analysis suggests abnormal RV and LV strain in patients with VA in follow-up. Kaplan–Meier analysis of RV and LV global and regional strain. Cut-offs for abnormal strain (red) and normal strain (blue) are calculated using ROC analysis. P-values were calculated using log-rank test. GCS, global circumferential strain; GLS, global longitudinal strain; LV, left ventricle; ROC, receiver operating characteristic; RV, right ventricle; VA, ventricular arrhythmia.

