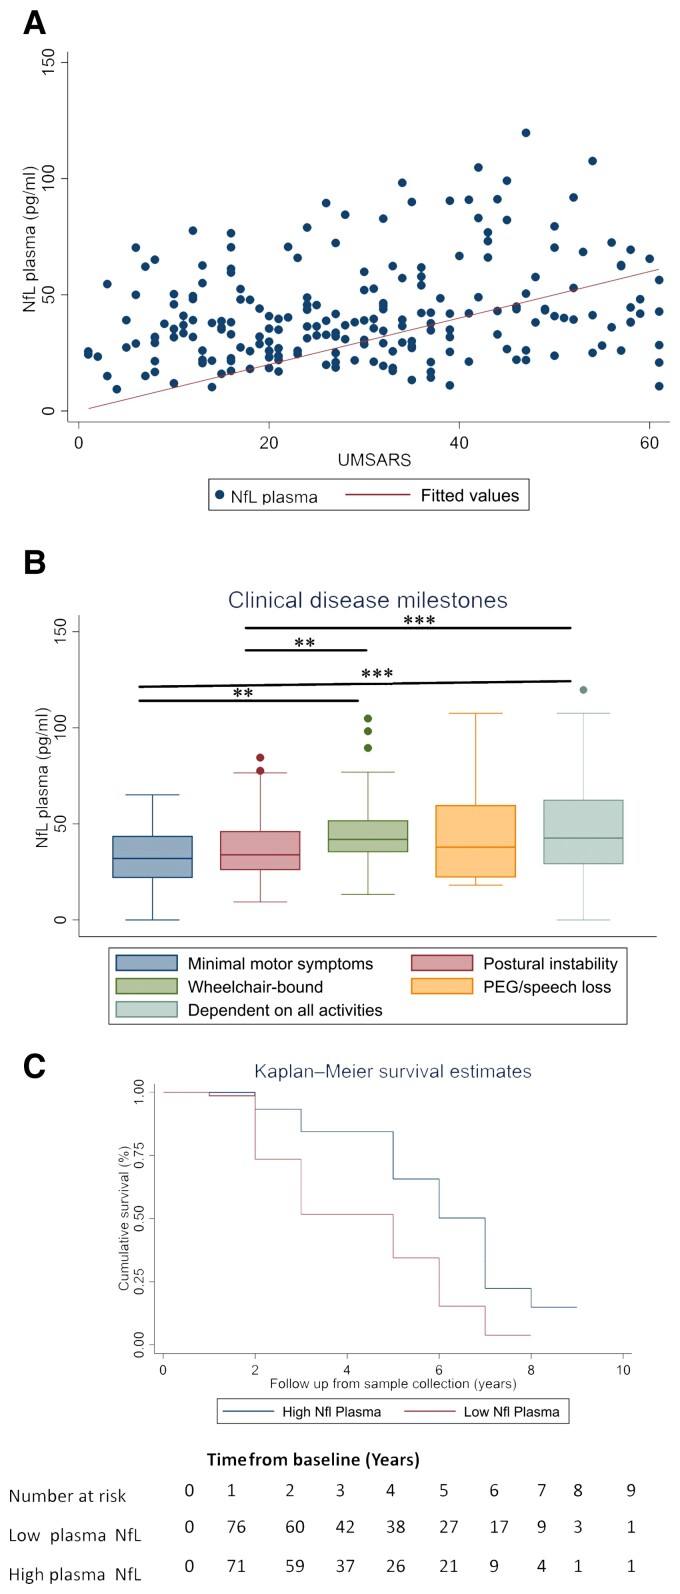
Figure 1.
NfL concentrations in patients with MSA correlate with disease severity and survival. (A) Associations between NfL concentrations in plasma at baseline and cross-sectional clinical measure of UMSARS in MSA cases (rho = 0.24, P < 0.001). (B) NfL concentrations in plasma and disease stages defined by the disease milestones. Baseline plasma NfL concentrations by disease stage. Boxes show first and third quartiles, the central band shows the median, and the whiskers show data within 1.5 IQR of the median. The dots represent outliers. ***P < 0.001. (C) Higher plasma NfL values [blood NfL values above median (>38.1 pg/ml)] were associated with a more rapid progression and shorter overall survival (95% CI 1.43–3.80, HR 2.35, P = 0.001) when comparing the Kaplan–Meier curve of NfL levels stratified by low plasma NfL levels (<38.1 pg/ml).

