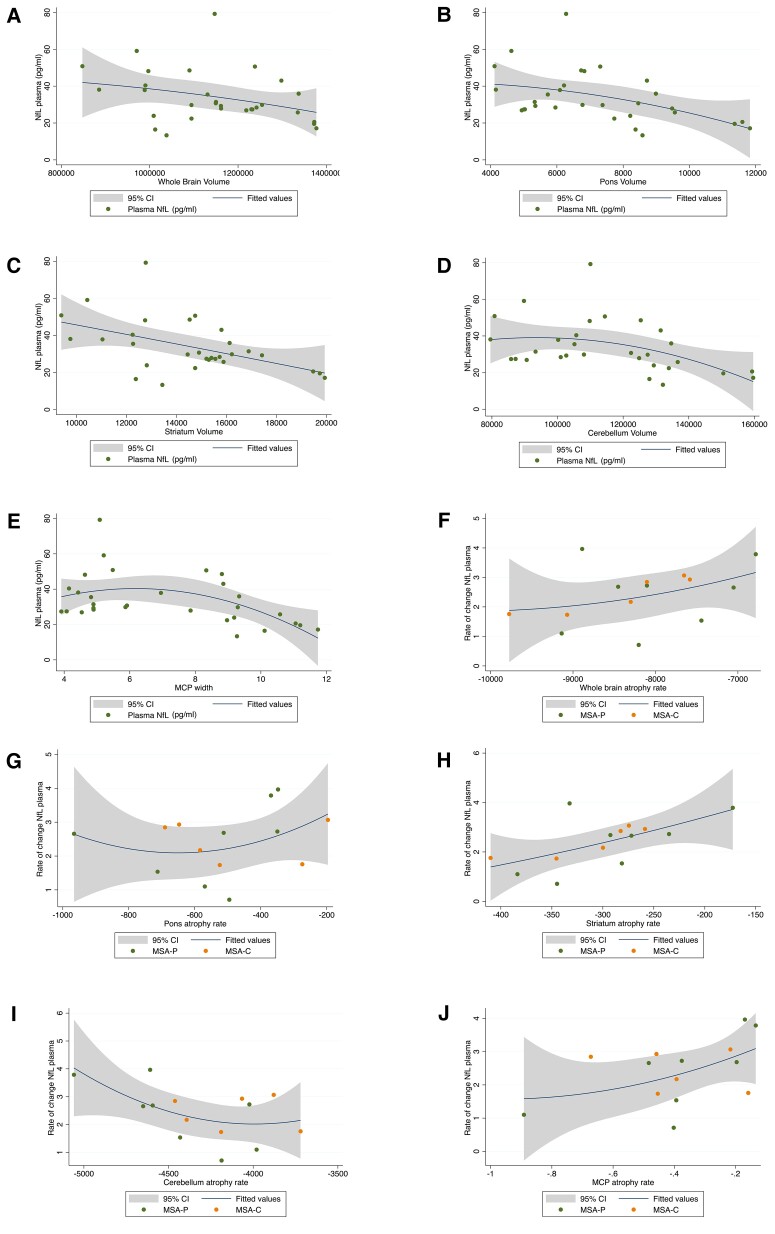
Figure 2.
Significant correlations between plasma NfL levels and neuroimaging outcomes. (A–E) Associations between baseline plasma NfL levels with raw global and regional brain volumes and MCP width. (F–J) Associations between yearly NfL rate of changes and yearly brain atrophy rate of changes in MSA.

