Figure 1.
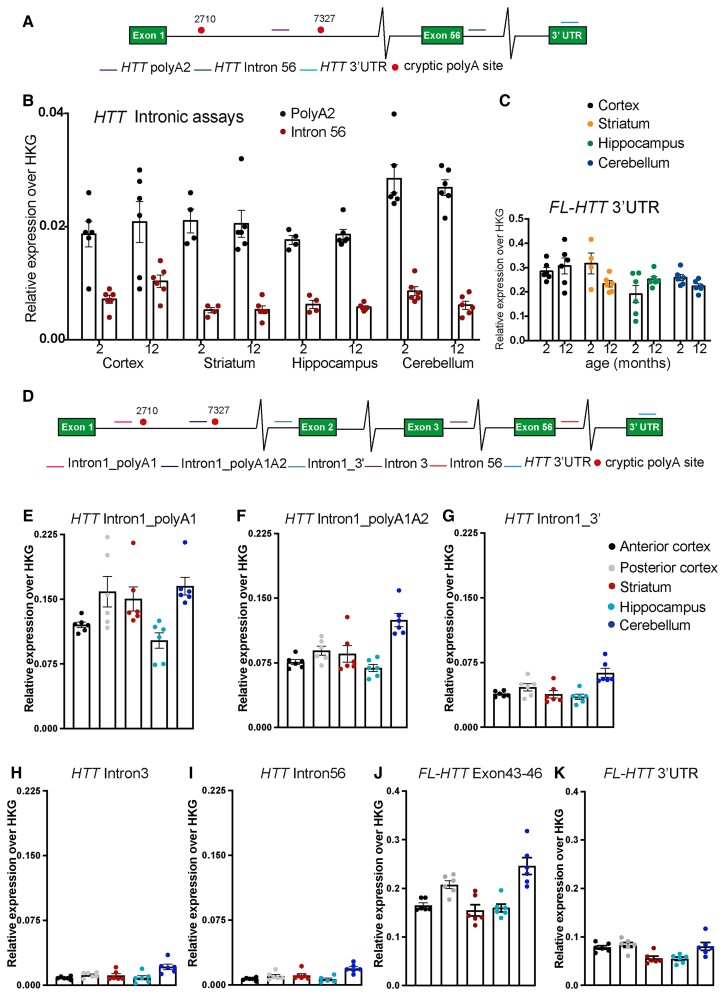
Quantitative PCR and QuantiGene analysis of full-length HTT and HTT1a transcripts in YAC128 brains. (A) Schematic of the location of the qPCR assays on the human HTT transcript. (B) HTT1a was detected in the cortex, striatum, hippocampus and cerebellum of 2- and 12-month-old YAC128 mice (n = 4–6/genotype). (C) Full-length HTT levels in the cortex, striatum, hippocampus and cerebellum as measured using the HTT_ 3′ UTR assay (n = 4–6/genotype). (D) Schematic of the location of the QuantiGene probe sets on the human HTT transcript. (E–I) Comparison of HTT intronic sequences between brain regions. HTT1a was detected by QuantiGene in the cortex, striatum, hippocampus and cerebellum of 2-month-old YAC128 mice (n = 4–6/genotype). (J and K) Full-length HTT detected by QuantiGene in the anterior and posterior cortex as well as in the striatum, hippocampus and cerebellum of 2-month-old YAC128 mice (n = 4–6/genotype). Two different QuantiGene probe sets targeting exons 43–46 or the 3′ UTR were designed to detect FL-HTT. The results are plotted on separate graphs as they render different signals due to the assay design.

