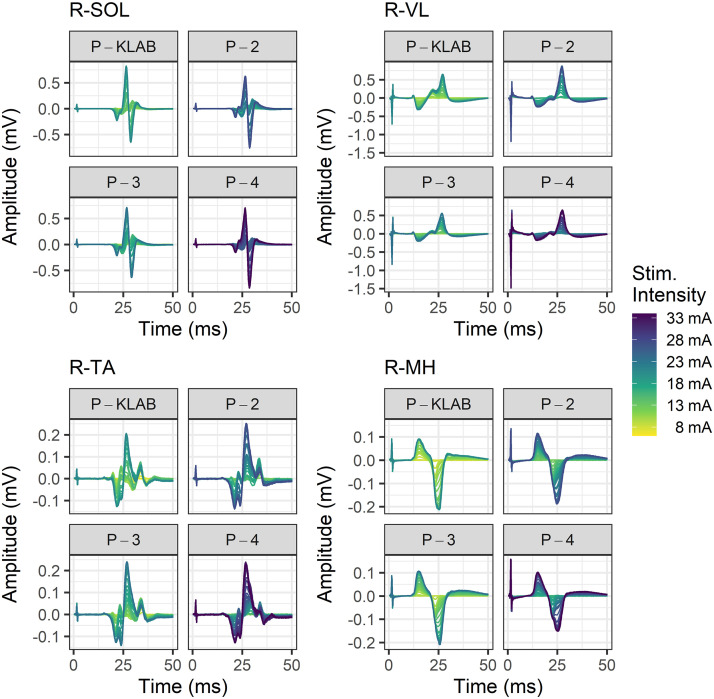
Figure 5.
Color-coded stimulation intensities and associated transspinal evoked potentials (TEPs). TEPs from a representative participant recorded at different stimulation intensities to construct the recruitment input-output curve for KNIKOU-LAB4Recovery protocol (P-KLAB), protocol 2 (P-2), protocol 3 (P-3), and protocol 4 (P-4). TEPs are shown for the right (R) soleus (SOL), vastus lateralis (VL), tibialis anterior (TA), and medial hamstring (MH) muscles. The stimulation intensity is color coded, with yellow and purple corresponding to low and high stimulation intensities, respectively.

