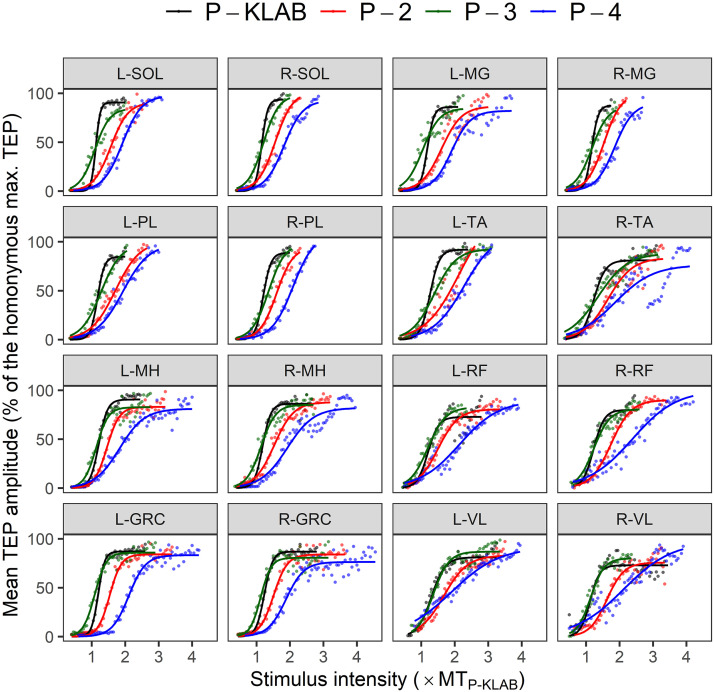
Figure 7.
Transspinal evoked potential (TEP) recruitment input-output curves. The amplitude of each TEP for each subject was normalized to the homonymous maximal TEP amplitude, plotted against the stimulation intensity normalized to the homonymous predicted right soleus TEP threshold intensity (TEPth) from the KNIKOU-LAB4Recovery protocol (P-KLAB) and grouped separately for each muscle and protocol based on multiples (MTs) of TEPth. The sigmoid function fitted to the data is shown. Mean R2 average values across subjects and protocols were for P-KLAB = 0.981 [95% confidence interval (CI), 0.975–0.986], protocol 2 (P-2) = 0.980 (95% CI, 0.972–0.985), protocol 3 (P-3) = 0.981 (95% CI, 0.974–0.986), and protocol 4 (P-4) = 0.979 (95% CI, 0.969–0.985). GRC, gracilis; L, left; MG, medial gastrocnemius, MH, medial hamstring; PL, peroneus longus; R, right; RF, rectus femoris; SOL, soleus; TA, tibialis anterior; VL, vastus lateralis.

