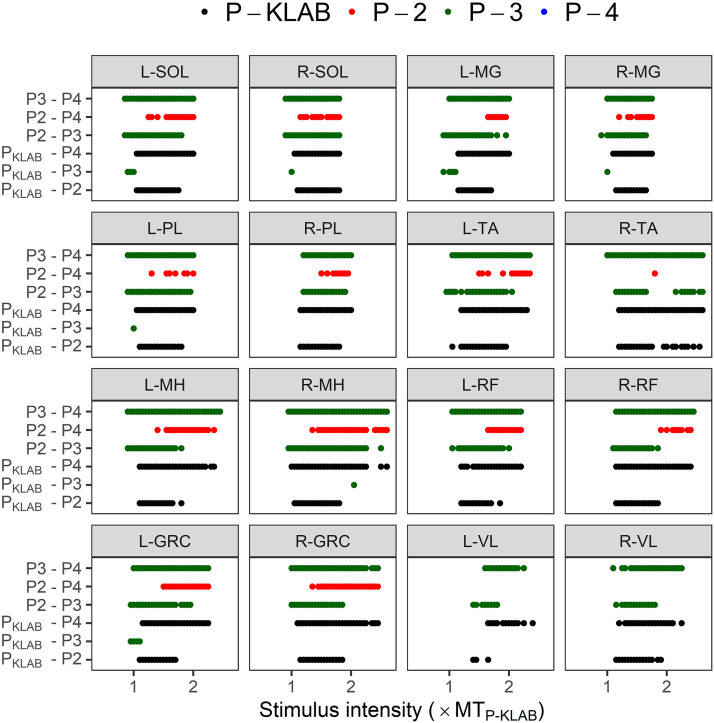
Figure 8.
Comparisons of transspinal evoked potential (TEP) recruitment input-output curves between KNIKOU-LAB4Recovery protocol (P-KLAB), protocol 2 (P-2), protocol 3 (P-3), and protocol 4 (P-4). Statistically significant differences of TEPs recorded at 1 × to 2.5 × the TEP threshold (MT) of P-KLAB based on Tukey’s post hoc comparisons between protocols (P < 0.05). The dots indicate statistically significant differences between protocols. The color of the dot indicates at which protocol the TEP amplitude is higher. For example, the green dots for the left soleus (SOL), same color representing P-3, indicate that TEP values of P-3 are higher than those of P-4. Similarly, the red dots for the left SOL, same color representing P-2, indicate that TEP values for P-2 are higher than those of P-4. TEP amplitudes for the recruitment curves for P-4 are not higher than for any other protocol, whereas P-KLAB and P-3 predominate. GRC, gracilis; L, left; MG, medial gastrocnemius, MH, medial hamstring; PL, peroneus longus; R, right; RF, rectus femoris; TA, tibialis anterior; VL, vastus lateralis.

