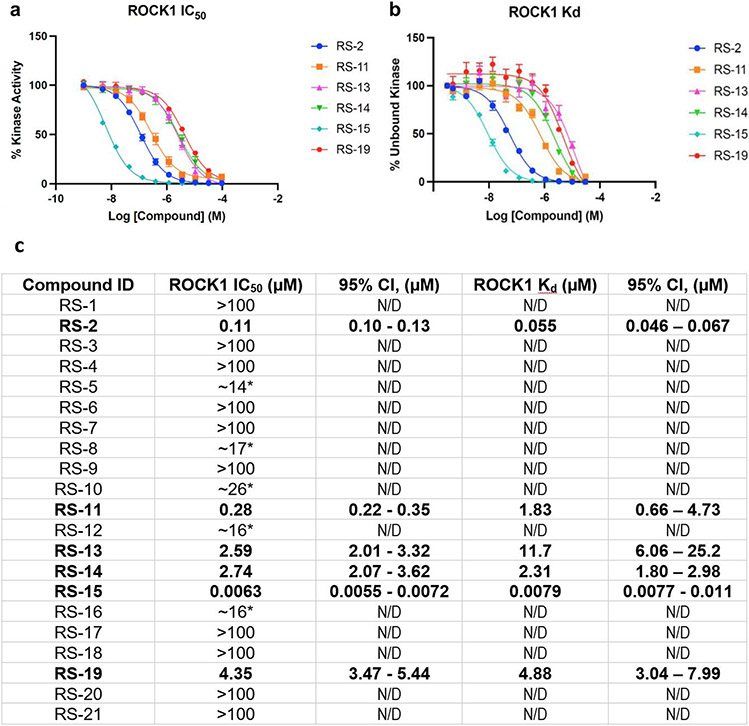
Extended Data Figure 14. Experimental characterization of candidate ROCK1 inhibitors predicted by V-SYNTHES.
Full dose-response curves for the ROCK1 hits in (a) functional potency and (b) binding affinity at human ROCK1. The data points are presented as mean ± SEM from n=3 independent experiments, each run carried out in triplicate. (c) Values of binding affinities and functional potencies for all candidate compounds predicted by V-SYNTHES. Bold font highlight hits with IC80<10 μM. Estimated values for curves that did not allow accurate fitting are marked with *.

