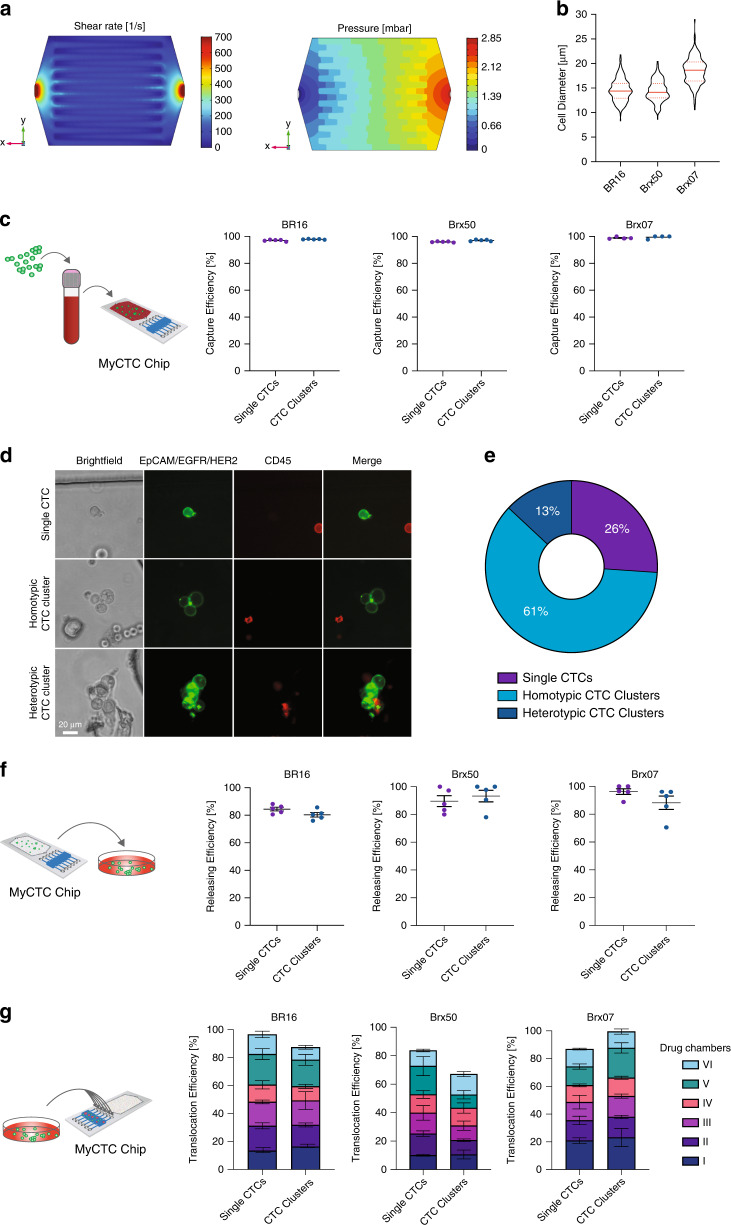
Fig. 2.
Capture, release and translocation efficiency. a Fluidic dynamic simulation showing the distribution of shear rates (left) and pressure drop (right) within the culture and capture section at a constant flow rate of 50 µL min−1. The viscosity of blood was set to 1–3 mPa∙s. b Size distribution of CTC-derived cell lines BR16, Brx50 and Brx07. Violin plots show the 25th, 50th and 75th percentiles. c Representation of the experimental design (left). Dot plots show the capture efficiency of single CTCs and CTC clusters from GFP- or RFP-tagged BR16, Brx50 and Brx07 cells spiked in healthy donor blood (right); n = 5 for BR16 and Brx50, n = 4 for Brx07; error bars represent s.e.m. d Representative brightfield and fluorescence images of single CTCs and homotypic and heterotypic CTC clusters isolated from the peripheral blood of a metastatic breast cancer patient using a MyCTC chip. Captured cells were stained with anti-EpCAM/EGFR/HER2 (green) and CD45 (red) antibodies. e Pie chart showing the percentages of single CTCs and homotypic and heterotypic CTC clusters isolated in d. f Representation of the experimental design (left). Dot plot showing the release efficiency from captured single and clustered CTCs of GFP- or RFP-tagged BR16, Brx50 and Brx07 cells (right); n = 5; error bars represent s.e.m. g A representation of the experimental design (left). Bar plot showing translocation efficiency from captured single and clustered CTCs of GFP- or RFP-tagged BR16, Brx50 and Brx07 cells into the six drug screening chambers (right); n = 3; error bars represent s.e.m

