Fig. 3.
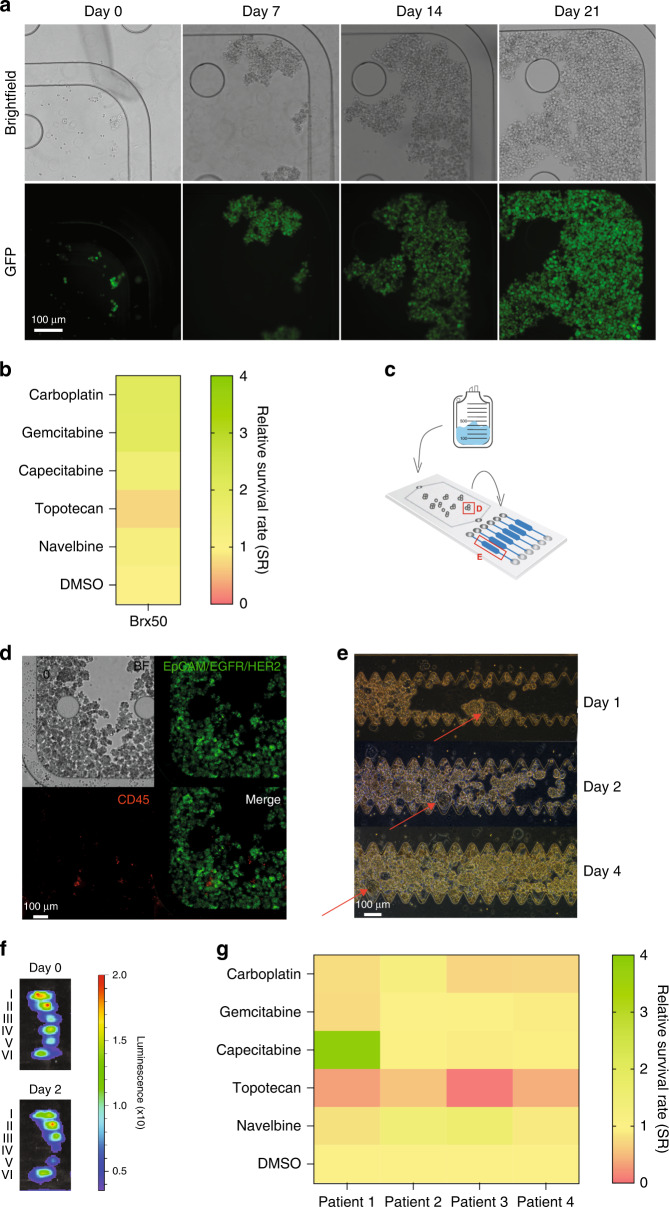
MyCTC chip culture and drug screening. a Brightfield and fluorescence images at different time points (days 0, 7, 14, 21) showing the growth of the GFP-tagged Brx50 CTC line inside the culture chamber of the MyCTC chip. b Heatmap representing the average relative survival rate (n = 2) of Brx50 cells at the endpoint measurement after two days of chemotherapeutic agent (I–VI) treatment. c Schematic representation of the workflow for patient-derived ascites fluid processing with the MyCTC chip. Red squares (d, e) represent the position on the chip that was used for imaging cell growth shown in d, e. d Representative brightfield and immunofluorescence images of captured patient-derived ascites fluid cancer cells in the capture and culture chamber stained for EpCAM/EGFR/HER2 (green) and CD45 (red). e Representative brightfield images of patient-derived ascites fluid cells in the drug screen chambers at different time points after translocation (days 1, 2, 4). Red arrows indicate the imaging reference point. f Representative images showing the bioluminescence signal of the drug screen chambers containing cancer cells from patient-derived ascites fluid samples (Table S1; Patient four) treated with (VI) carboplatin, (V) gemcitabine, (IV) capecitabine, (III) topotecan, (II) navelbine and (I) DMSO control before (day 0) and 2 days after drug treatment. Bioluminescence levels indicate the viability of cancer cells from patient-derived ascites fluid samples. g Heatmap representing the average relative survival rate (n = 2) of cancer cells from patient-derived ascites fluid at the endpoint measurement

