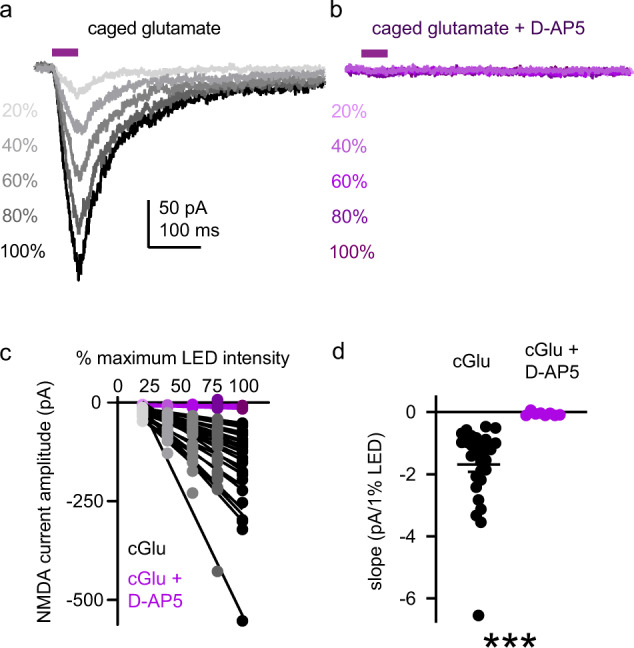
Fig. 3. All PV+ interneurons contain functional somatodendritic NMDARs.

a, b Dose-response relationship between LED intensity (20–100% maximum intensity; intervals of 20%) and NMDAR-mediated UVEPSC amplitude in representative PV+ interneurons (−55 mV holding potential) in the absence (a) or presence (b) of D-AP5 (50 µM). c Dose-response relationship for each PV+ interneuron tested in the absence (gray; n = 29 neurons) or presence (purple; n = 8 neurons) of D-AP5. Points represent UVEPSC amplitude at a given stimulus intensity for an individual PV+ interneuron. Lines represent the best fit of the dose-response measurement for each neuron determined by simple linear regression. d Summary of regression line slopes plotted in c. Slopes are steeper for PV+ interneurons in the absence (black; n = 29 neurons; −1.69 ± 0.24 pA/1% LED) compared to the presence of D-AP5 (purple; n = 8 neurons; −0.06 ± 0.02 pA/1% LED; U = 0; p < 0.001). Data represented as mean ± SEM. ***p < 0.001; Mann–Whitney test for unpaired comparisons (d).
