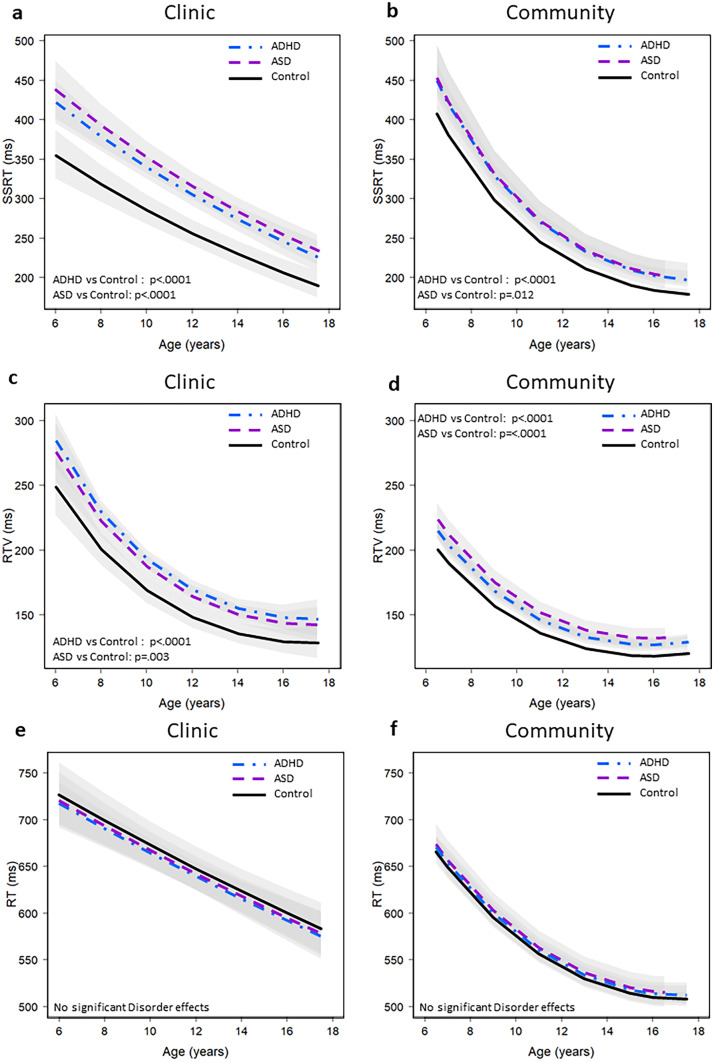
Fig. 1.
Stop Signal Task performance in Clinic and Community samples. Distribution of stop-signal reaction time (SSRT – Panel A & B), reaction time variability (RTV – Panel C & D) and reaction time (RT – Panel E & F). Clinic samples are presented on the left side (Figure a ASD: n= 233, ADHD: n=371, Controls: n=159 and c; e ASD: n=261, ADHD: n=423, Controls: n=162) and community samples are presented on the right side (Figure b ASD: n=123, ADHD: n=698, Controls: n=11,428) and d, f ASD: n=144, ADHD: n=749, Controls: n= 12,095). The bands around each line represent the 95% confidence interval. These values are not corrected for comorbidity

