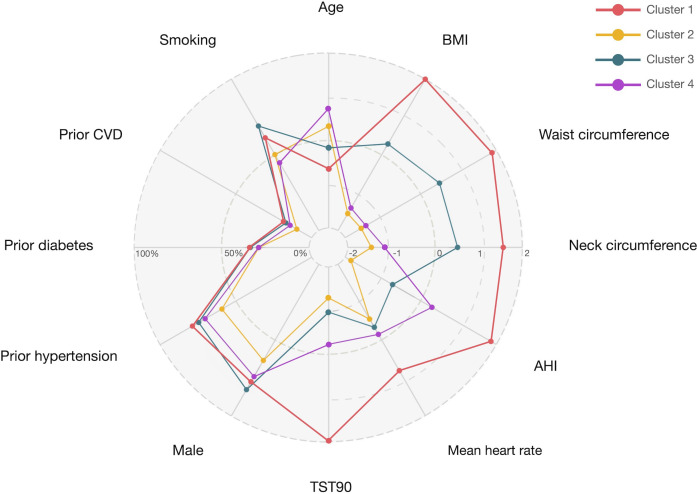
Figure 3.
Radar chart comparing 12 characteristics of patients with moderate–severe OSA in each of the four clusters. Since these 12 indicators have different ranges, z-standardised scores were plotted for quantitative variables and proportions for categorical variables to simplify the interpretation of the chart. AHI, apnoea–hypopnoea index; BMI, body mass index; CVDs, cardiovascular diseases; OSA, obstructive sleep apnoea; TST90, sleep time with oxygen saturation below 90%.

