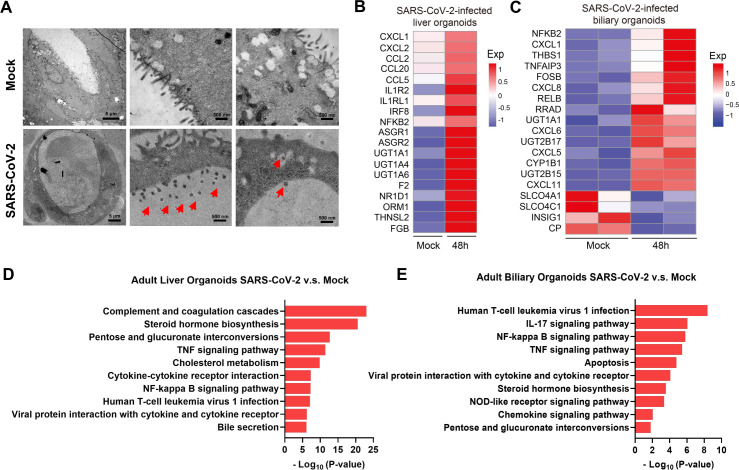
Figure 2.
(A) Representative TEM imaging of biliary organoids at 0 and 24 hours of SARS-CoV-2 virus infection. Coronaviruses were observed in the lumen of the organoid (arrows) and are found at the membrane-bound vesicles (arrows). Scale bar 500 nm to 5 µm. (B, C) Heatmaps depicting the 19 most significantly enriched genes related to viral infection and immune system on SARS-CoV-2 infection in liver and biliary organoids. Coloured bar represents the log2-transformed values. (D, E) KEGG orthology-based annotation system of differential gene expression profiles from SARS-CoV-2-infected liver and biliary organoids compared with mock infection. TEM, transmission electron microscope.

