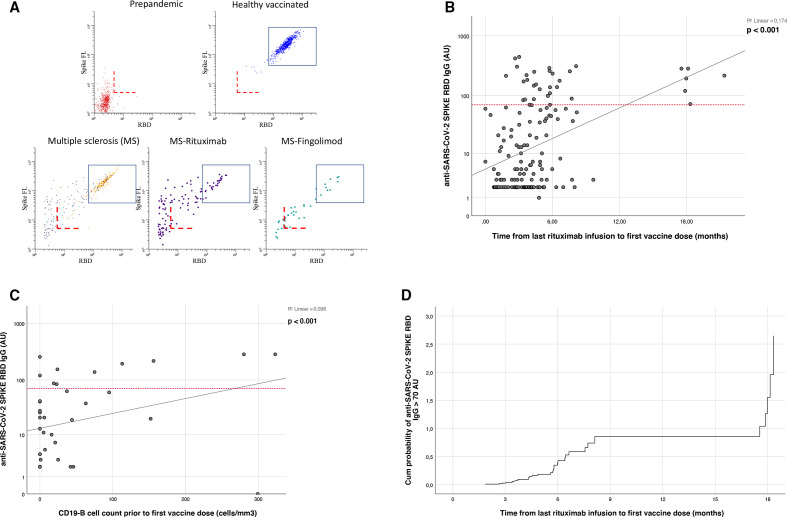
Figure 1.
(A) COVID-19 vaccine response in healthy individuals and people with MS. The dot plots show levels of antibodies to SARS-CoV-2 Spike Protein (y-axis) and the receptor-binding domain (RBD) for indicated cohort. The dashed red lines correspond to assay cut-off determined for sero-prevalence screening (5 anti-SARS-CoV-2 SPIKE RBD IgG arbitrary units), while the rectangle shows the range of signals measured for more than >99% of vaccinated healthy individuals (<70 anti-SARS-CoV-2 SPIKE RBD IgG arbitrary units). The lower end corresponds to approximately 40 WHO binding antibody units (BAUs). (B) Scatter plot showing the correlation between time since last rituximab infusion and anti-SARS-CoV-2 SPIKE RBD IgG levels (AU). The red reference line on the Y-axis is positioned at 70 AU. (C) Scatter plot showing the correlation between CD19+ B-lymphocyte count (cells/mm3) prior to first vaccine dose and anti-SARS-CoV-2 SPIKE RBD IgG levels (AU, n=47, median of 2 months between CD19+ B-lymphocyte count and first vaccine dose). The red reference line on the Y axis is positioned at 70 AU. (D) Cox proportional-hazard model showing the cumulative probability of mounting a normal immune response (anti-SARS-CoV-2 SPIKE RBD IgG >70 AU) in relation to time since last rituximab infusion.

