Figure 4.
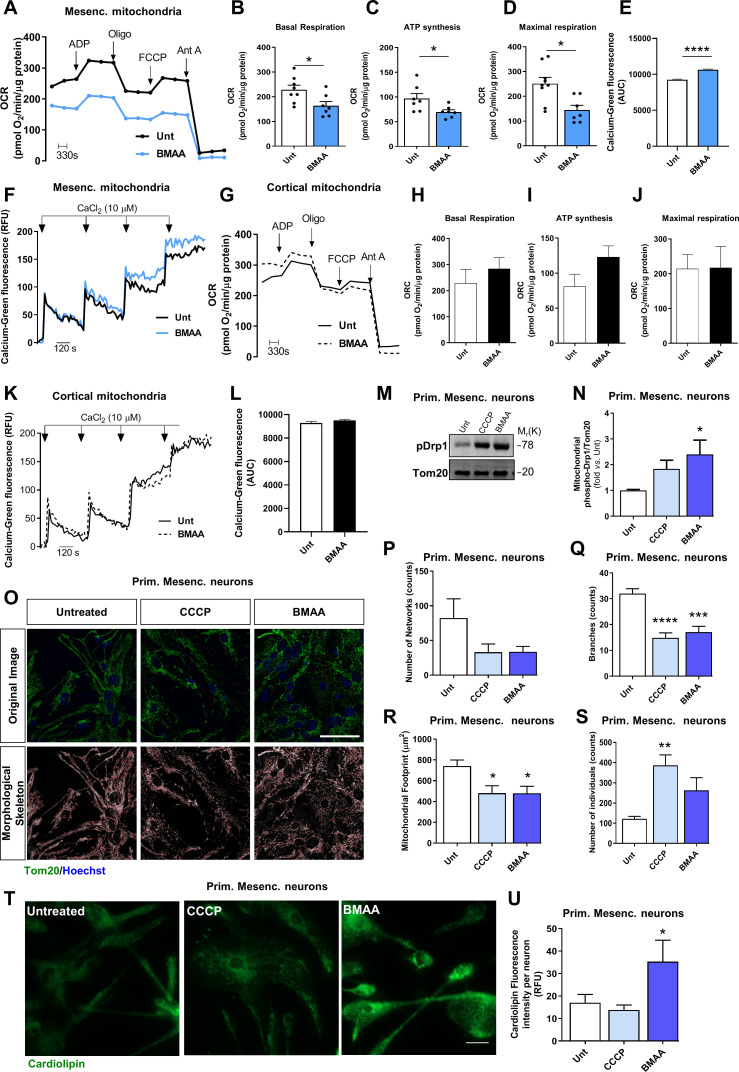
β-N-methylamino-L-alanine (BMAA) induces neuronal mitochondrial dysfunction, fragmentation and cardiolipin exposure. Isolated mesencephalic mitochondria from untreated (Unt) and BMAA-treated mice were examined. (A) Representative graph showing oxygen consumption rate (OCR); (B) basal respiration; (C) ATP synthesis; (D) maximal respiration. Values are pmol O2/min/μg protein. (B–D, n values for all conditions=7, Unt vs BMAA, B, *p=0.0125, C *p=0.0286 and D, *p=0.020). (E–F) Mesencephalic mitochondria’s ability to uptake calcium was evaluated with the fluorescent probe Calcium-green (n values for all conditions=4, Unt vs BMAA, ****p<0.0001). Isolated cortical mitochondria from Unt and BMAA-treated mice were examined. (G) Representative graph showing OCR in the cortex; (H) basal respiration; (I) ATP synthesis; (J) maximal respiration. Values are pmol O2/min/μg protein. (H–J) n values for all conditions=4, Unt vs BMAA; H, p=0.4456; I, p=0.1246 and J, p=0.9689). (K–L) Cortical mitochondria’s ability to uptake calcium was evaluated with the fluorescent probe calcium-green (n values for all conditions=4, Unt vs BMAA, p=0.1870). (M–U) Primary mesencephalic neuronal cultures were treated with 3 mM BMAA and 1 µM CCCP for 2 hours. (M) Representative immunoblot for phospho-Drp1 levels and (N) respective densitometric analysis. The blots were re-probed for TOM20 to confirm equal protein loading and mitochondrial fraction purity (n values for Unt and CCCP=4, BMAA=3. Unt vs CCCP, p=0.0711; Unt vs BMAA, *p=0.0375). (O) Primary mesencephalic neurons were immunostained with Tom20. (P–S) Alterations in mitochondrial network were calculated with an ImageJ Macro tool (n values for all conditions=6). (P) Number of mitochondrial networks (Unt vs CCCp, p=0.2674; Unt vs BMAA, p=0.3169). (Q) Number of mitochondrial branches (Unt vs CCCP, ****p<0.0001; Unt vs BMAA, ***p=0.0002). (R) Mitochondrial footprints (Unt vs CCCP, *p=0.0247; Unt vs BMAA, *p=0.0241). (S) Number of mitochondrial individuals (Unt vs CCCP, **p=0.026; Unt vs BMAA, p=0.0968). (T) Representative images of cardiolipin exposure which was visualised with the fluorescent dye 10-N-nonyl acridine orange. (U) Cardiolipin fluorescence was calculated with ImageJ. Data is reported as absolute values (n values for all conditions=6, Unt vs CCCP, p=0.676; Unt vs BMAA, *p=0.0255). Scale bars in O=50 µm and T=33 µm. Data represents mean+SEM. Statistical analysis: Unpaired Student’s t-test was performed in B–E, H–J and L. One-way analysis of variance followed by Dunnett’s test was performed in N, Q–S and U. Kruskal-Wallis test followed by Dunn’s test was performed in P.

