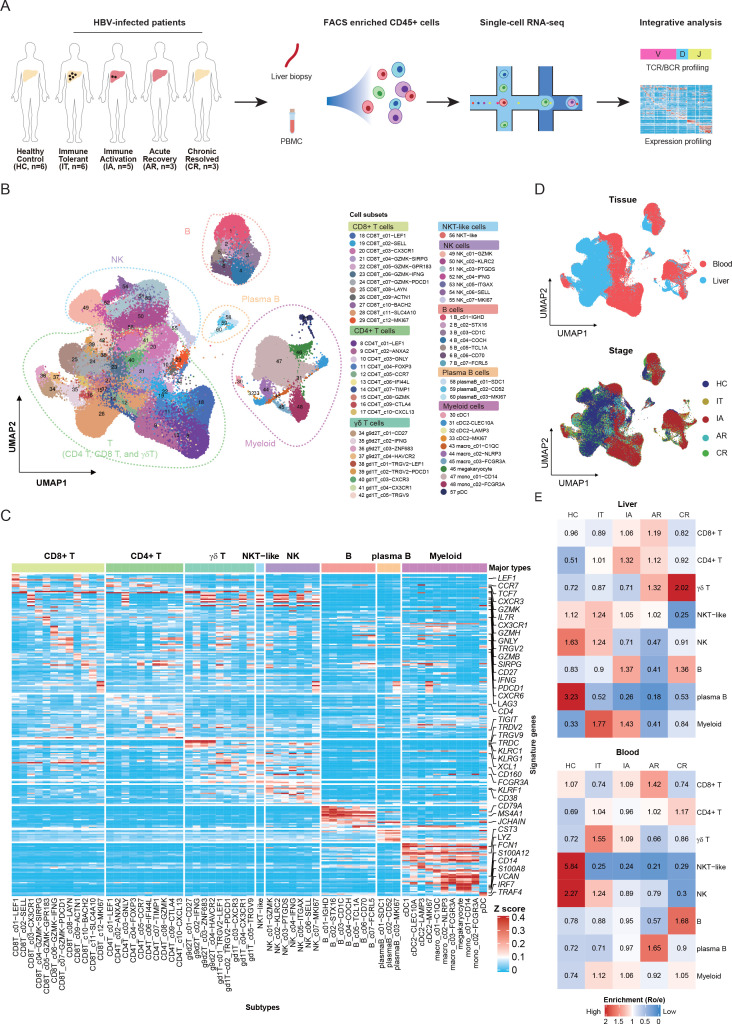
Figure 1.
Single-cell transcriptome map of immune cells in liver and blood. (A) An experimental scheme diagram of the overall study design. Hepatic immune cells and paired PBMCs were collected and subjected for cell barcoding. The cDNA libraries of 5′-mRNA expression, TCR and BCR were constructed independently, followed by high-throughput sequencing and downstream analyses. (B) UMAP plots of the 243 000 single cells from 23 individuals, including 8 major clusters and 60 subclusters. (C) Gene expression heatmap in each cell cluster. EXP, z-score normalised mean expression. (D) UMAP plots of major cell clusters showing tissue distribution and stage distribution. (E) Tissue prevalence of major cell clusters estimated by Ro/e score. AR, acute recovery; BCR, B-cell receptor; cDNA, complementary DNA; CR, chronic resolved; HC, healthy control; IA, immune active; IT, immune tolerant; NK, natural killer; PBMC, peripheral blood mononuclear cell; TCR, T-cell receptor; UMAP, uniform manifold approximation and projection.

