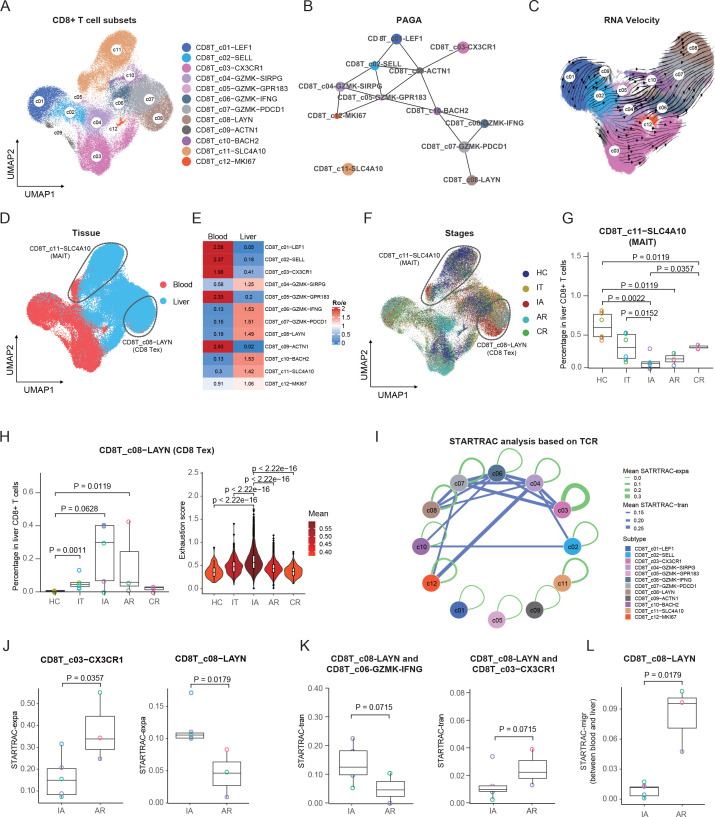
Figure 2.
Immunological features of CD8+ T-cell subsets. (A) UMAP plots of CD8+ T-cell subsets. (B) PAGA analysis showing the potential developmental connectivity between different CD8+ T-cell subsets. (C) RNA velocity analysis showing the transition potential among CD8+ T-cell subsets. (D) UMAP plots of CD8+ T-cell subsets showing tissue distribution. (E) Tissue prevalence of CD8+ T-cell subsets estimated by Ro/e score. (F) UMAP plots of CD8+ T-cell subsets showing stage distribution. (G) Box plots showing the proportions of MAIT cells in liver CD8+ T cells across stages. One-sided unpaired Wilcoxon test. (H) Box plots showing the proportions and violin plots showing the exhaustion scores of Tex cells across stages. One-sided unpaired Wilcoxon test. (I) Clonal expansion and state transition of CD8+ T-cell subsets estimated by STARTRAC analysis based on all patients. (J) Box plots showing the expansion levels (STARTRAC-expa) of Temra and Tex subsets in IA and AR stages. One-sided unpaired Wilcoxon test. (K) Box plots showing the transition scores (STARTRAC-tran) between Tex and CD8T_c06-GZMK-IFNG and CD8T_c03−CX3CR1 in IA and AR stages. One-sided unpaired Wilcoxon test. (L) Box plots showing the migration scores (STARTRAC-migr) of the Tex subset between blood and liver in IA and AR stages. One-sided unpaired Wilcoxon test. AR, acute recovery; CR, chronic resolved; HC, healthy control; IA, immune active; IT, immune tolerant; MAIT, mucosal-associated invariant T; PAGA, partition-based graph abstraction; STARTRAC, single T-cell analysis by RNA sequencing and TCR tracking; Temra, recently activated effector memory or effector T; Tex, exhausted CD8+ T; UMAP, uniform manifold approximation and projection.

