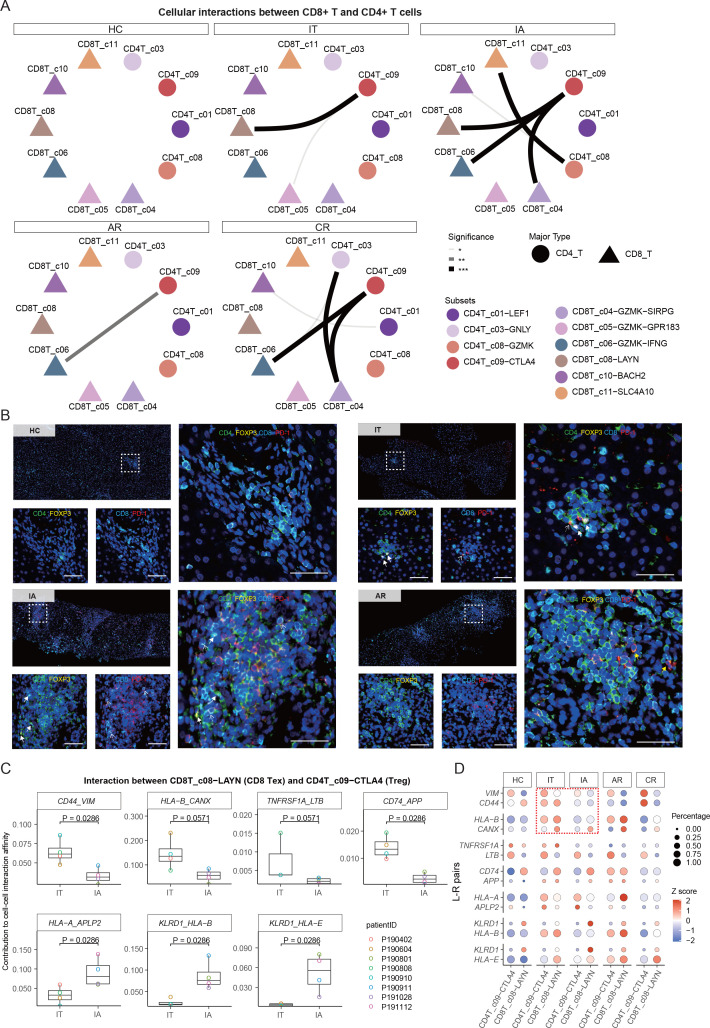
Figure 4.
Multicolour IHC staining of Treg and Tex cells in the liver. (A) CSOmap analysis showing the interaction between CD8+ T-cell and CD4+ T-cell subsets. (B) Multicolour IHC staining in the liver across HC, IT, IA and AR groups. One representative image for each group is shown. White dotted arrows indicate Tex cells, white solid arrows indicated Tregs, yellow solid arrows indicated CD4 +PD1+cells. scale bar, 50 µm. (C) Box plots showing the contributions of indicated L-R pairs to interaction affinity between Tex and Treg in IT and IA stages. one-sided unpaired Wilcoxon test. (D) Bubble heatmap showing the selected L-R pairs between Treg and Tex cells. AR, acute recovery; CR, chronic resolved; CSOmap, cellular spatial organisation mapper; HC, healthy control; IA, immune active; IHC, immunohistochemistry; IT, immune tolerant; L-R, ligand–receptor; Tex, exhausted CD8+ T; Treg, regulatory T-cell.

