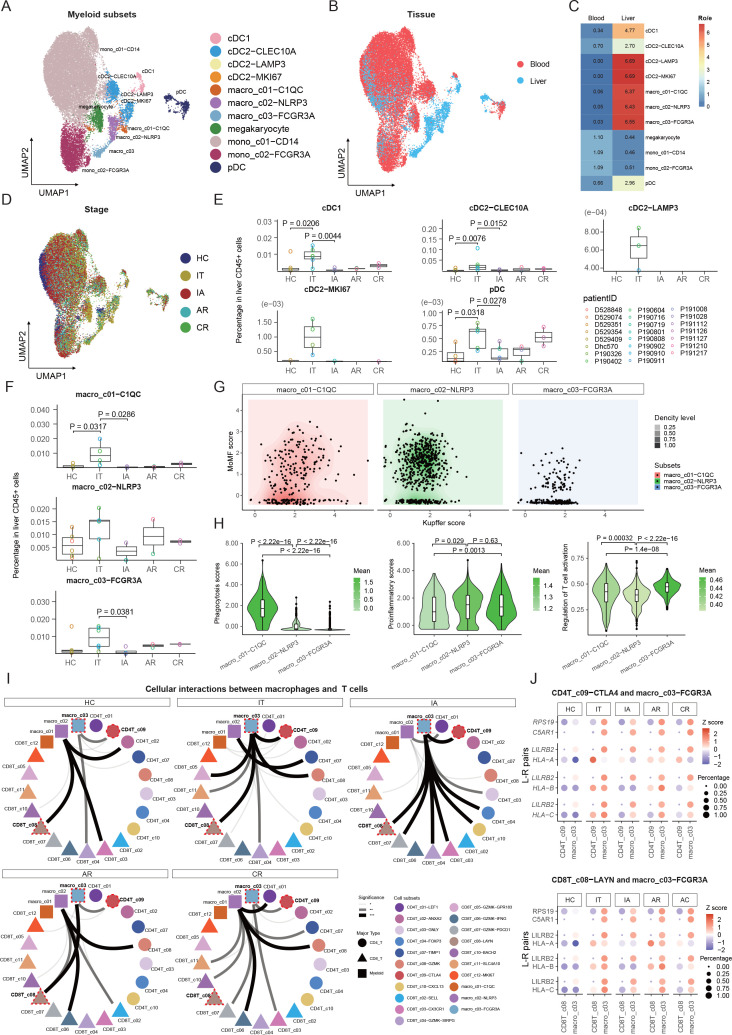
Figure 5.
Immunological features of myeloid cell subsets and interaction with T cells. (A) UMAP plots of myeloid cell subsets. (B) UMAP plots of myeloid cell subsets showing tissue distribution. (C) Tissue prevalence of myeloid cell subsets estimated by the Ro/e score. (D) UMAP plots of myeloid cell subsets showing stage distribution. (E) Box plots showing the proportions of DC subsets in liver CD45+ cells across stages. One-sided unpaired Wilcoxon test. (F) Box plots showing the proportions of macrophage subsets in liver CD45+ cells across stages. One-sided unpaired Wilcoxon test. (G) Dot plots of macrophages defined by Kupffer score and MoMF score. (H) Violin plots showing the functional scores (phagocytosis, proinflammatory, regulation of T-cell activation) of macrophage subsets across stages. One-sided unpaired Wilcoxon test. (I) CSOmap analysis showing the interaction between macrophage and T-cell subsets. (J) Bubble heatmap showing the selected ligand-receptor pairs between FCGR3A+ macrophage and Treg or Tex cells. AR, acute recovery; CR, chronic resolved; CSOmap, cellular spatial organisation mapper; DC, dendritic cell; HC, healthy control; IA, immune active; IT, immune tolerant; Tex, exhausted CD8+ T; Treg, regulatory T-cell; UMAP, uniform manifold approximation and projection.

