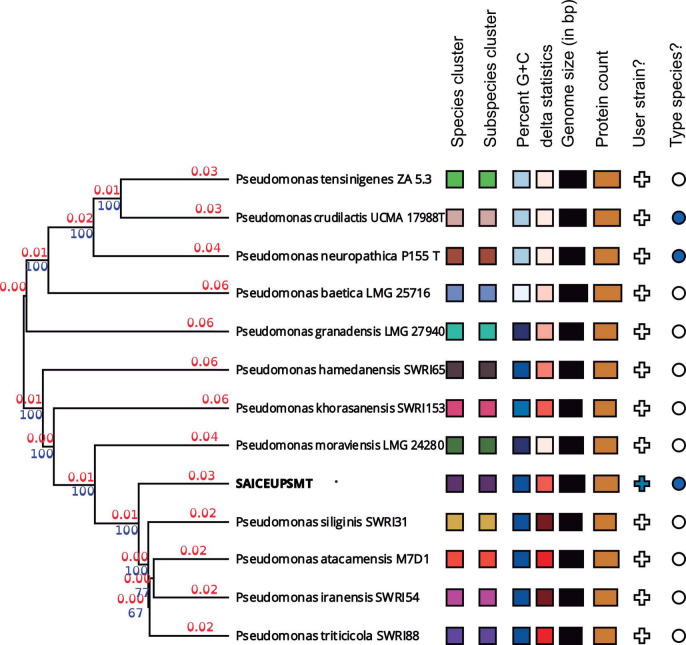
FIGURE 1.
Phylogenetic tree from the complete genome of the species of the genus Pseudomonas. Numerical values indicate the relative distance between the analyzed species. The branch lengths are scaled in terms of Genome Blast Distance Phylogeny (GBDP) d5. The blue numbers are GBDP pseudo-bootstrap support values >60% from 100 replications, with an average branch support of 55.2%. The branch length values (in red) represent the evolutionary time between two nodes. Unit: substitutions per sequence site. The tree was rooted at the midpoint.

