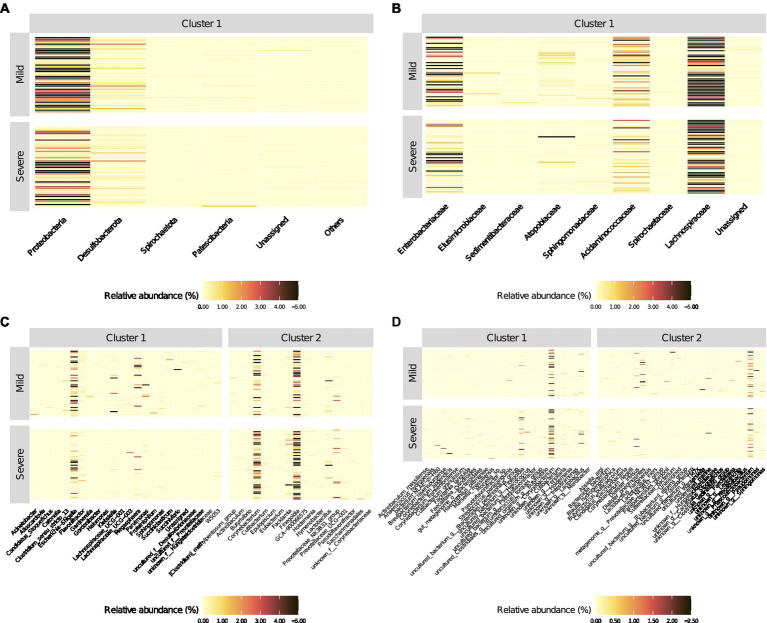
Figure 3.
Heatmaps of relative abundance (%) of bacterial populations identified (into different clusters) by the PEnalized LOgistic Regression Analysis at different taxonomic hierarchy, grouped by COVID-19 patients with mild and severe symptoms, respectively. The order of the rows (patients) was determined by the main heatmap, which has been defined at the Phylum level. All other heatmaps are automatically adjusted according to the settings in the main heatmap.

