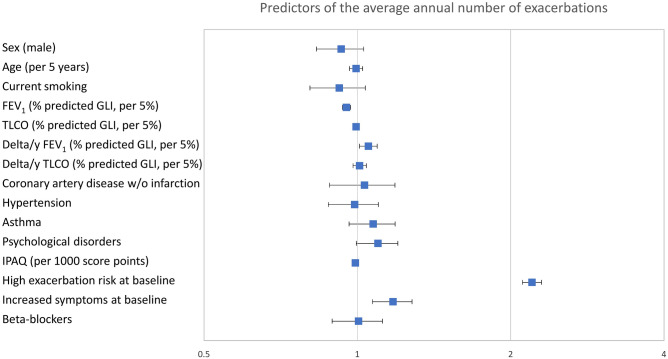
Figure 3.
Predictors of the average annual number of exacerbations. Odds ratios and 95% confidence intervals for predictors of the mean annual number of exacerbations according to Poisson regression analysis. The numerical values correspond to those of Supplementary Table 4. The predictors shown are those which were statistically significant (p < 0.05) in multivariable analyses of either increased mortality or rate of exacerbations to ensure comparability with Fig. 2, additionally asthma as important respiratory comorbidity. All predictors except for the decline in lung function (delta/y) refer to baseline values at the initial visit. Increased COPD symptoms correspond to GOLD groups B or D and high exacerbation risk to GOLD groups C or D at baseline. FEV1 = forced expiratory volume in 1 s; TLCO = diffusing capacity for carbon monoxide; IPAQ = International Physical Activity Questionnaire.

