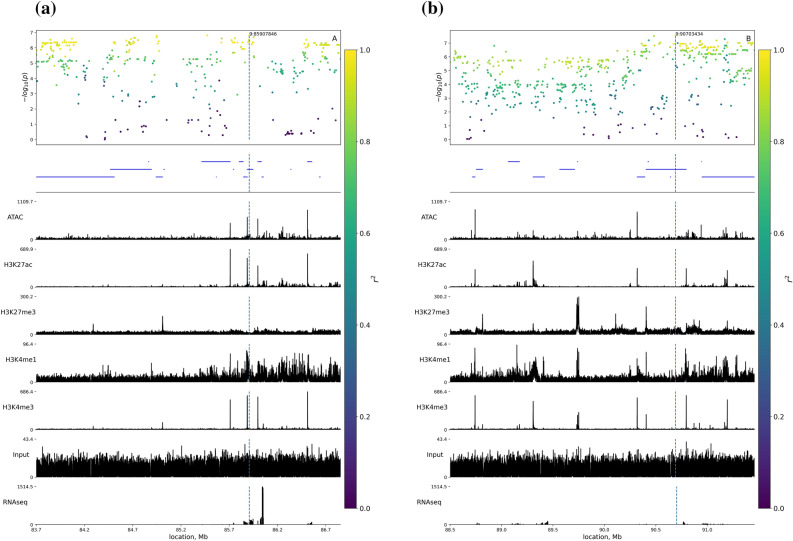
Figure 2.
Plots of QTL-1 (a) and QTL-2 (b) GWAS results, gene location, and epigenetic markers enrichment. X-axes indicate genome positions, Y-axis in the top panel indicates − log (p values). Linkage disequilibrium between the lead SNP and other SNPs is highlighted by color. Blue lines represent the location of genes, the remaining plots illustrate epigenetic marker enrichment scores. Score values on Y-axes correspond to aligned read counts in the ChIP-seq analysis reported by Pan et al. 202120.

