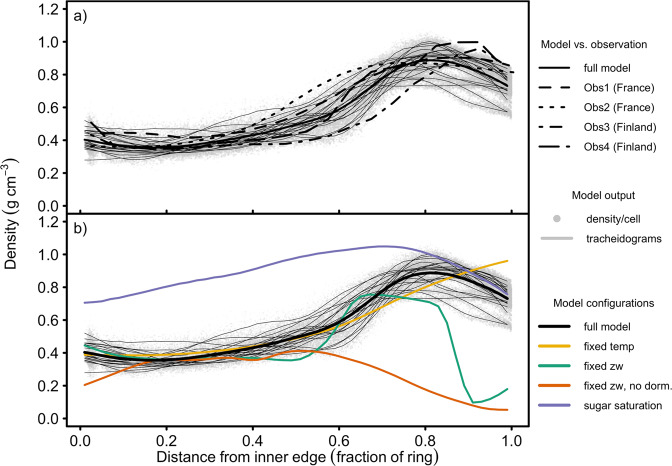
Fig. 2. Simulated cell-mass densities (i.e. cell mass/volume) across normalised ring width of Pinus sylvestris L. at 64.25°N, 19.75°E (northern Sweden), 1976–1995.
Simulations used a spin-up over 1951–1975, with proliferating cells carried over between years. Light grey solid lines are annual mean profiles of simulated cell-mass density standardised across 100 independent radial files per simulation. Wider solid lines (representing different model configurations) are the mean of all annual cell-mass density profiles (light grey lines in the case of the default simulation) across the entire simulation period. The mean profiles were calculated by binning cells in 0.02-fraction-wide bins and then computing the running mean over three adjacent bins. a Comparison with observations of the same species from: France, morphometric density (Obs1)19; France, X-ray (Obs2)19; southern Finland, X-ray (Obs3)47; and northern Finland, X-ray (Obs4)47. b Effects of changing model assumptions on density. Fixed temperature (“fixed temp”): 10 °C for cell enlargement and wall thickening; fixed zone widths (“fixed zw”): developmental zones always at their 20th June values, with or without autumn dormancy; sugar saturation assumes ΔM = ΔMmax (Eq. (8)). Individual annual simulation outputs are shown in Supplementary Fig. 1.

