FIGURE 5.

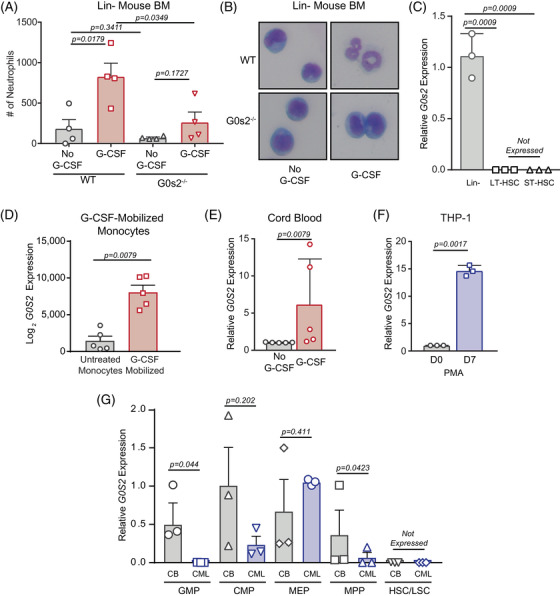
G0/G1 switch gene 2 (G0S2) expression correlates with myeloid development, and reduced expression in chronic myeloid leukaemia (CML) occurs within the granulocyte–macrophage progenitor (GMP) population. (A and B) Bar graph shows the number (#) of neutrophils counted in Wright–Geimsa stains of lineage‐negative (Lin−) mouse bone marrow (BM) from wild‐type or G0s2−/− mice induced towards neutrophil differentiation with murine granulocyte‐colony stimulating factor (mG‐CSF) (A). The image shows representative morphology for the indicated treatment conditions (B). (C) Bar graph represents relative G0s2 mRNA expression in the bulk Lin− BM fraction compared with sorted long‐term (LT) and short‐term (ST) haematopoietic stem cells (HSCs) (n = 3). (D) Bar graph shows G0S2 mRNA expression in haematopoietic cells after in vivo mobilisation with G‐CSF for 7 days (GSE1746, n = 5). (E and F) Bar graphs show G0S2 mRNA expression in cord blood (CB) CD34+ cells induced to differentiate with human G‐CSF (hG‐CSF) (E, n = 5), or THP‐1 cells induced to differentiate with phorbol 12‐myristate 13‐acetate (PMA) for 7 days (F, n = 3). (G) Bar graph shows relative G0S2 mRNA expression in CD34+ cells from normal CB (n = 3, left) or chronic phase CML (CP‐CML) patients (n = 3, right) that were sorted for GMPs, common myeloid progenitors (CMPs), megakaryocyte–erythrocyte progenitors (MEPs), multipotent progenitors (MPPs) or HSCs based on cell surface molecule expression. G0S2 mRNA expression was universally low in normal HSCs and CP‐CML leukaemic stem cells (LSCs), and significantly reduced in CP‐CML versus CB GMPs. Error bars represent standard error of the mean (SEM).
